
Designing an AI-powered interface for visualizing data in global communications networks.
Project OverviewThe 2024 Spring Design Studio focused on supporting Target Digital Network Analysts (TDNAs) in the U.S. intelligence community. Our goal was to design AI-driven systems that visualize data movement across the global communications network and seamlessly integrate it into their workflows.
My ResponsibilitiesI shared research, development, and design responsibilities. My unique contributions were the design of the Querying Sandbox and the node trees for data analysis.
Problem StatementTDNAs face challenges in understanding and applying data within the complex global communications landscape.Their work requires bridging foundational knowledge, advanced tools, and specialized tradecraft while navigating dynamic systems and legal frameworks. The lack of intuitive systems to connect data movement with workflow contexts is cognitively demanding, making analysis and decision-making more difficult.
SolutionIn response to user needs and the established problem space, our team developed DataTrace — an AI-powered tool for novice TDNAs to conduct smarter search, precise analysis, and targeted summary.
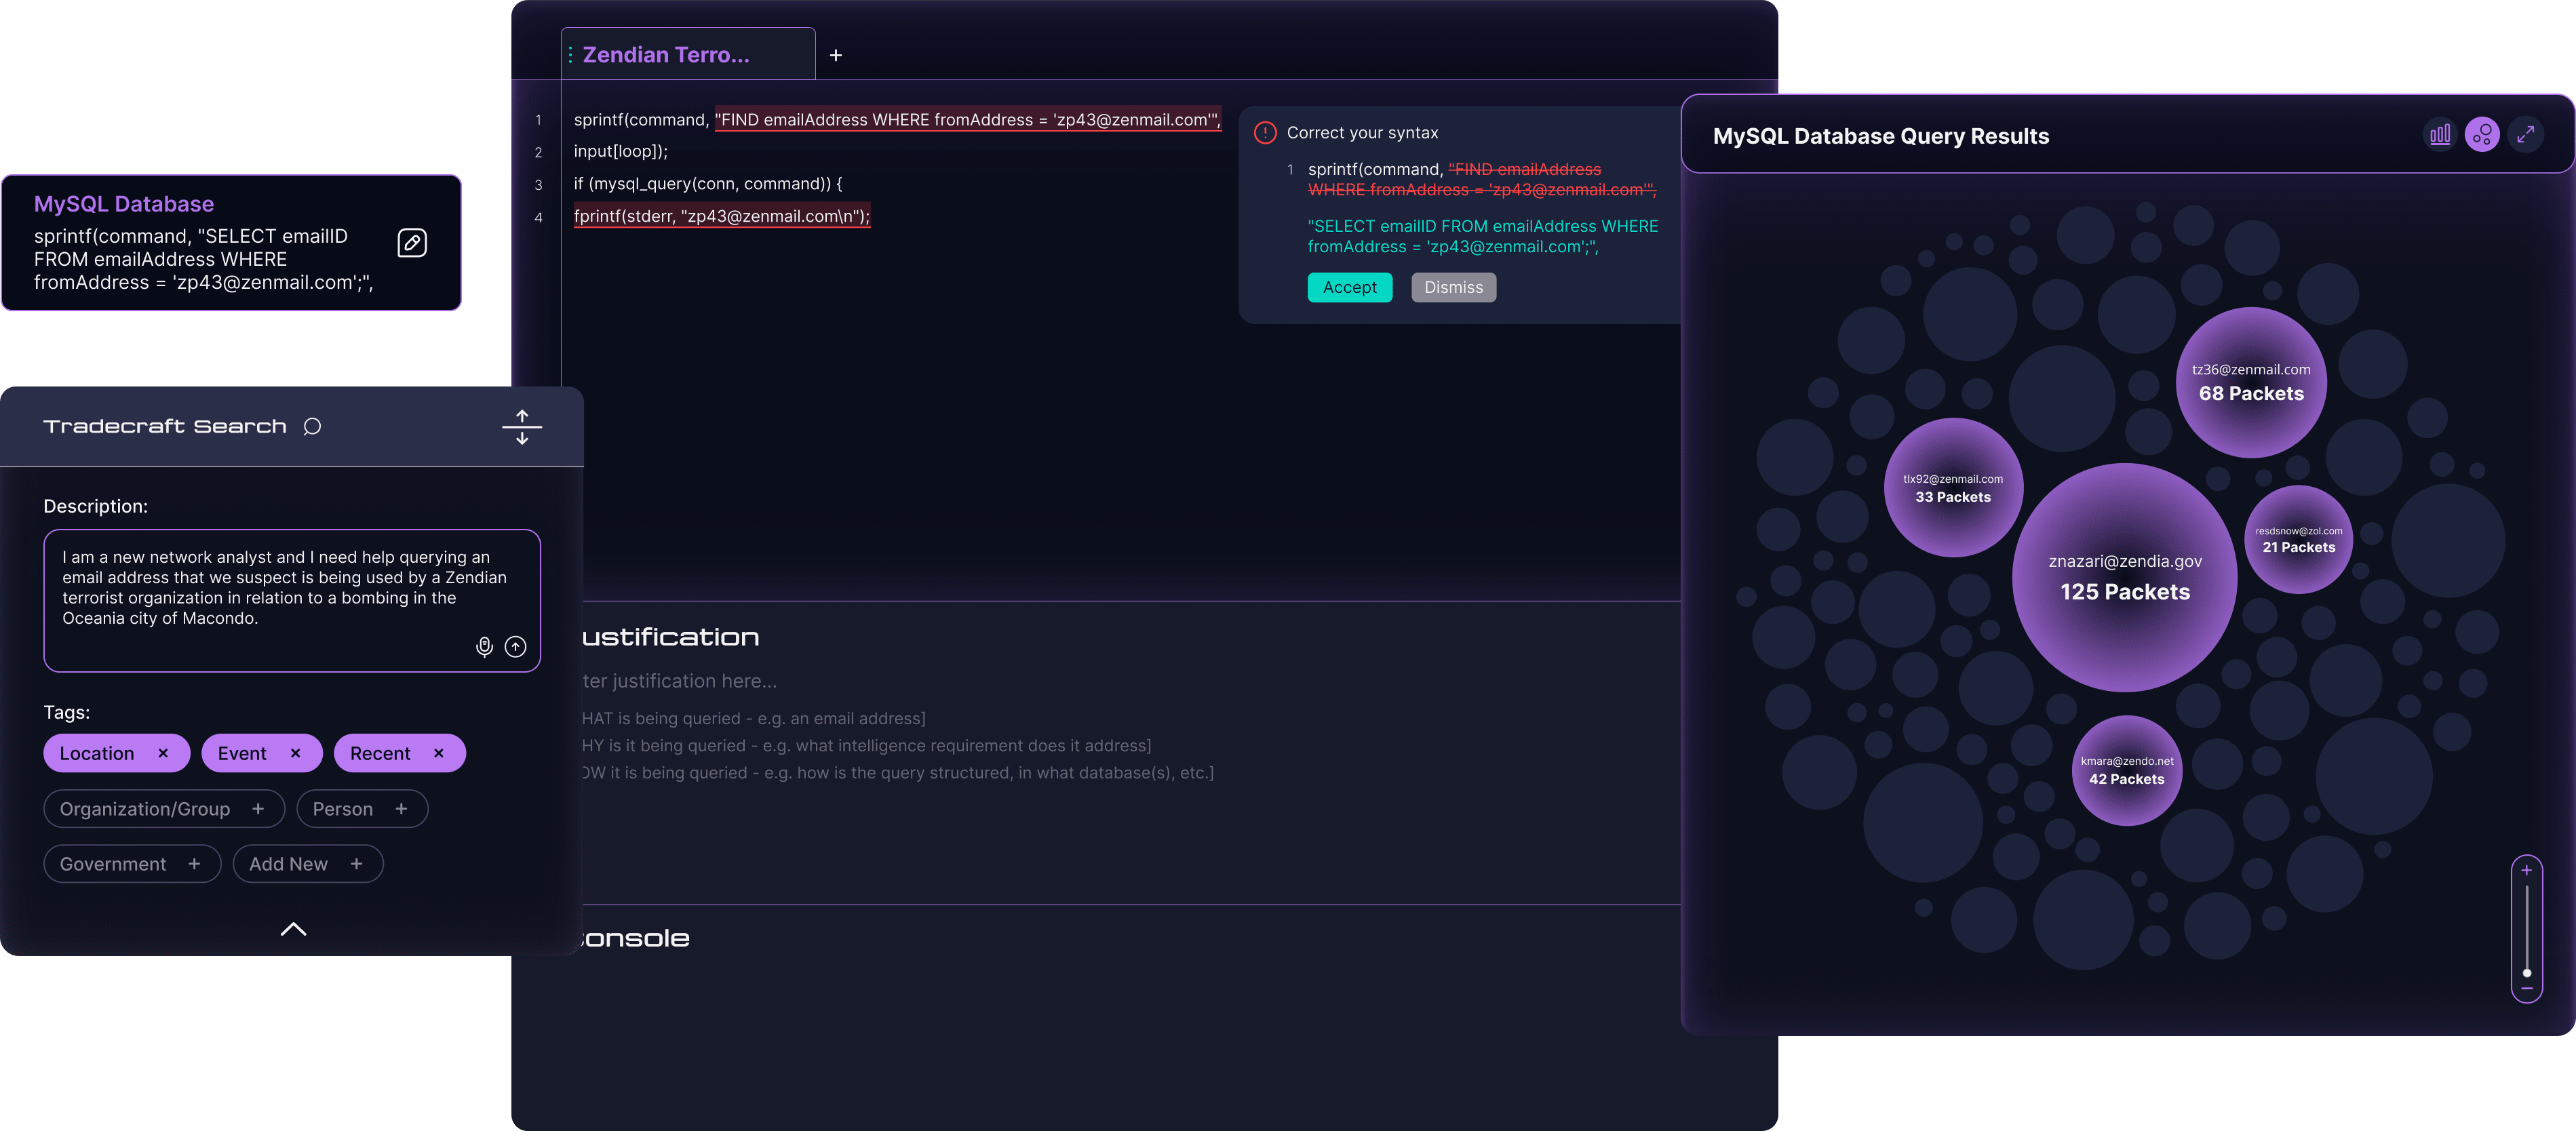
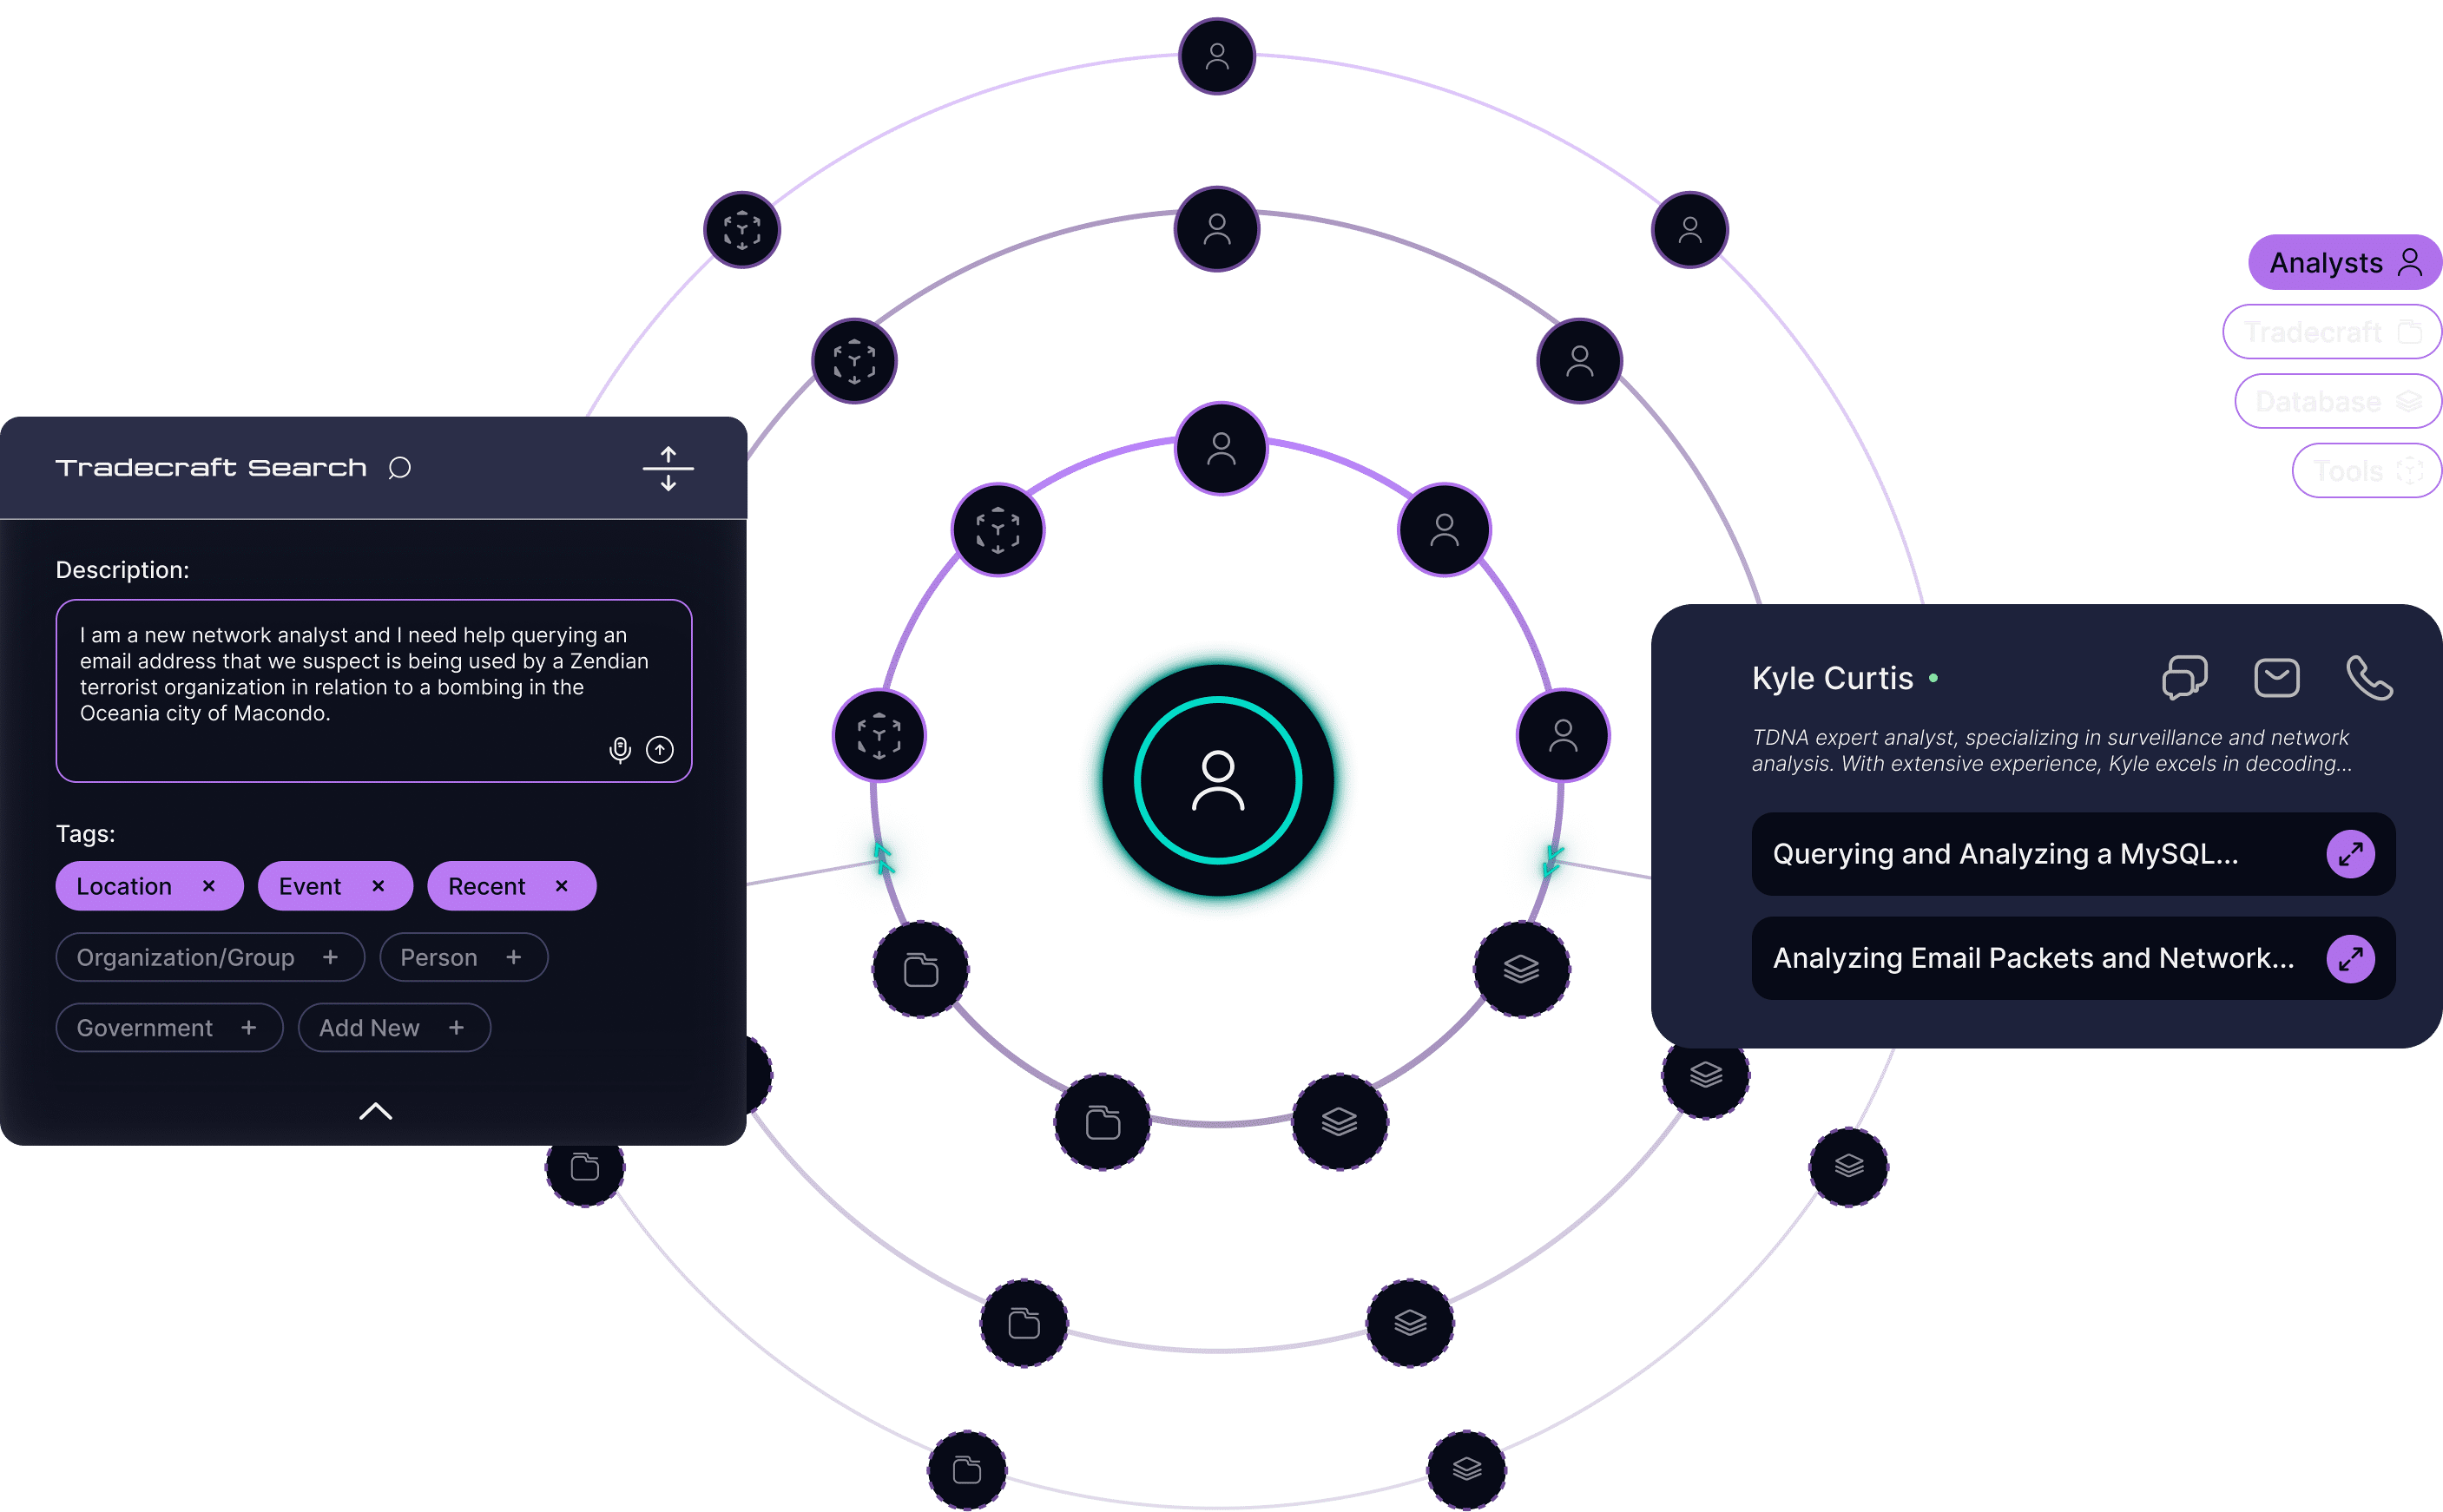
Tradecraft Search
AI-powered search helps analysts access tradecraft documents relevant to their investigation.The visualization categorizes the results into two distinct fields based relevance and reliability.
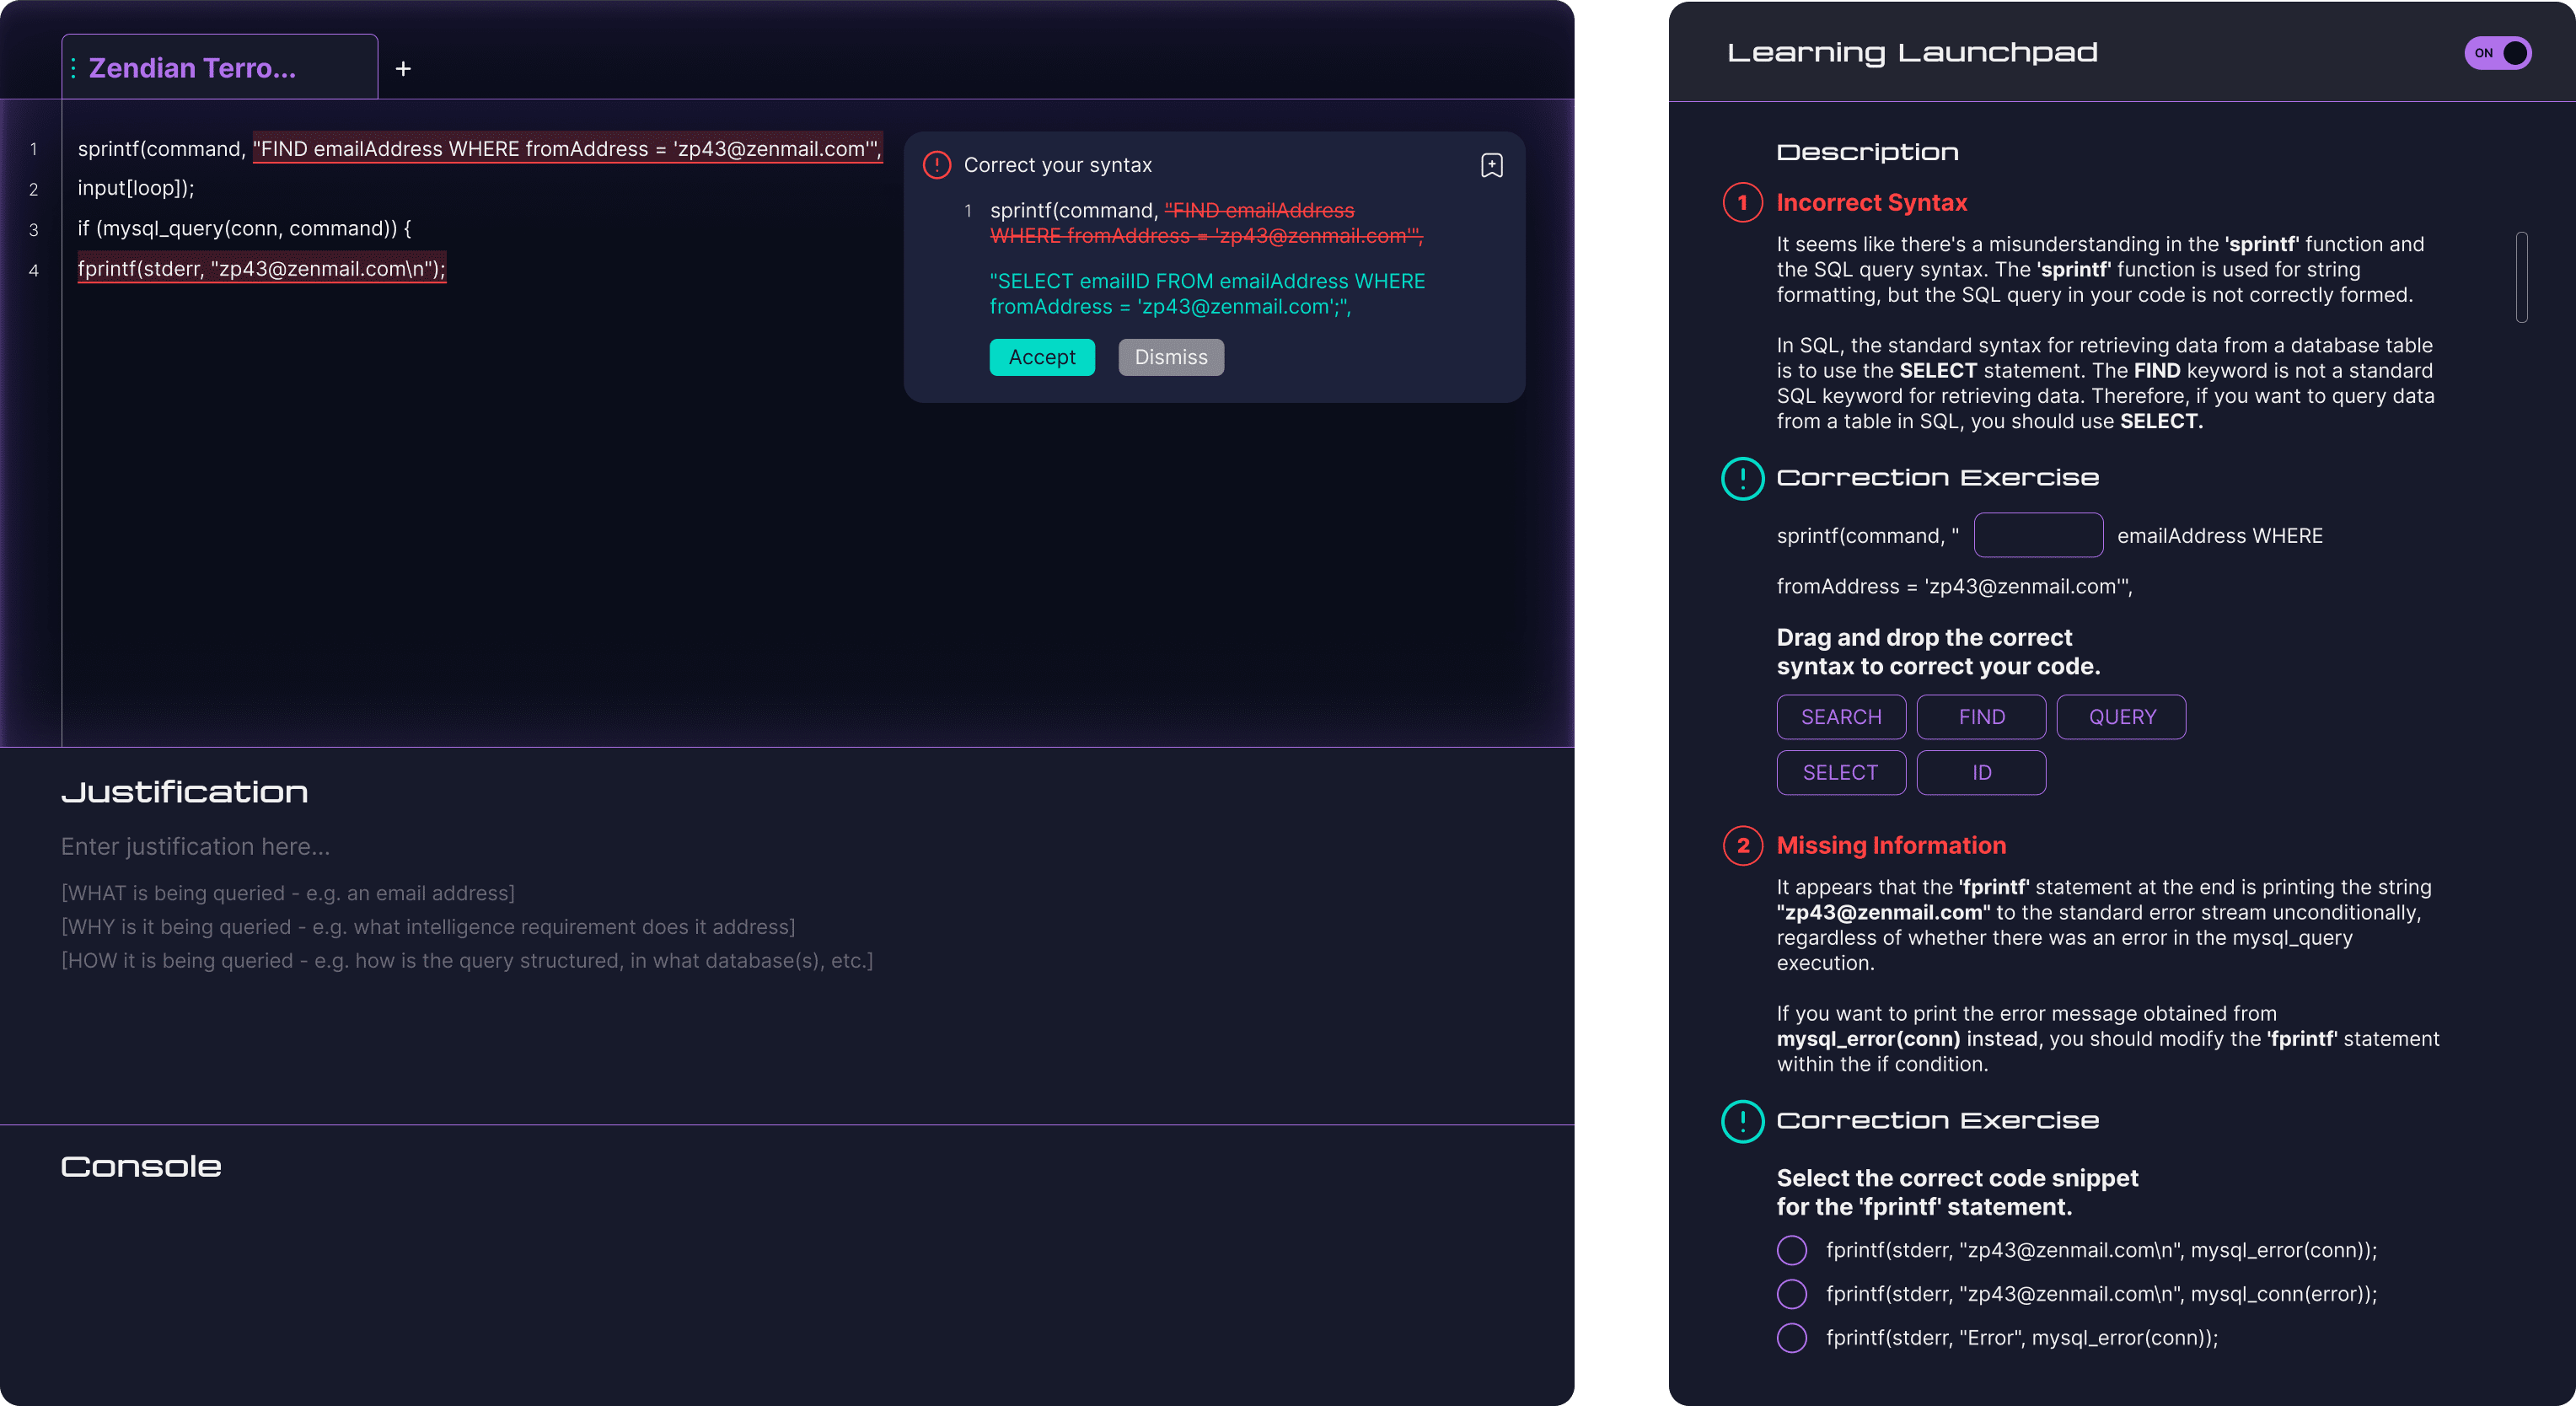
Querying Sandbox
Analyst can experiment with syntax and refine queries in a low-stakes environment.Syntax correction ensures compliance and the Learning Launchpad provides additional support for novice analysts.
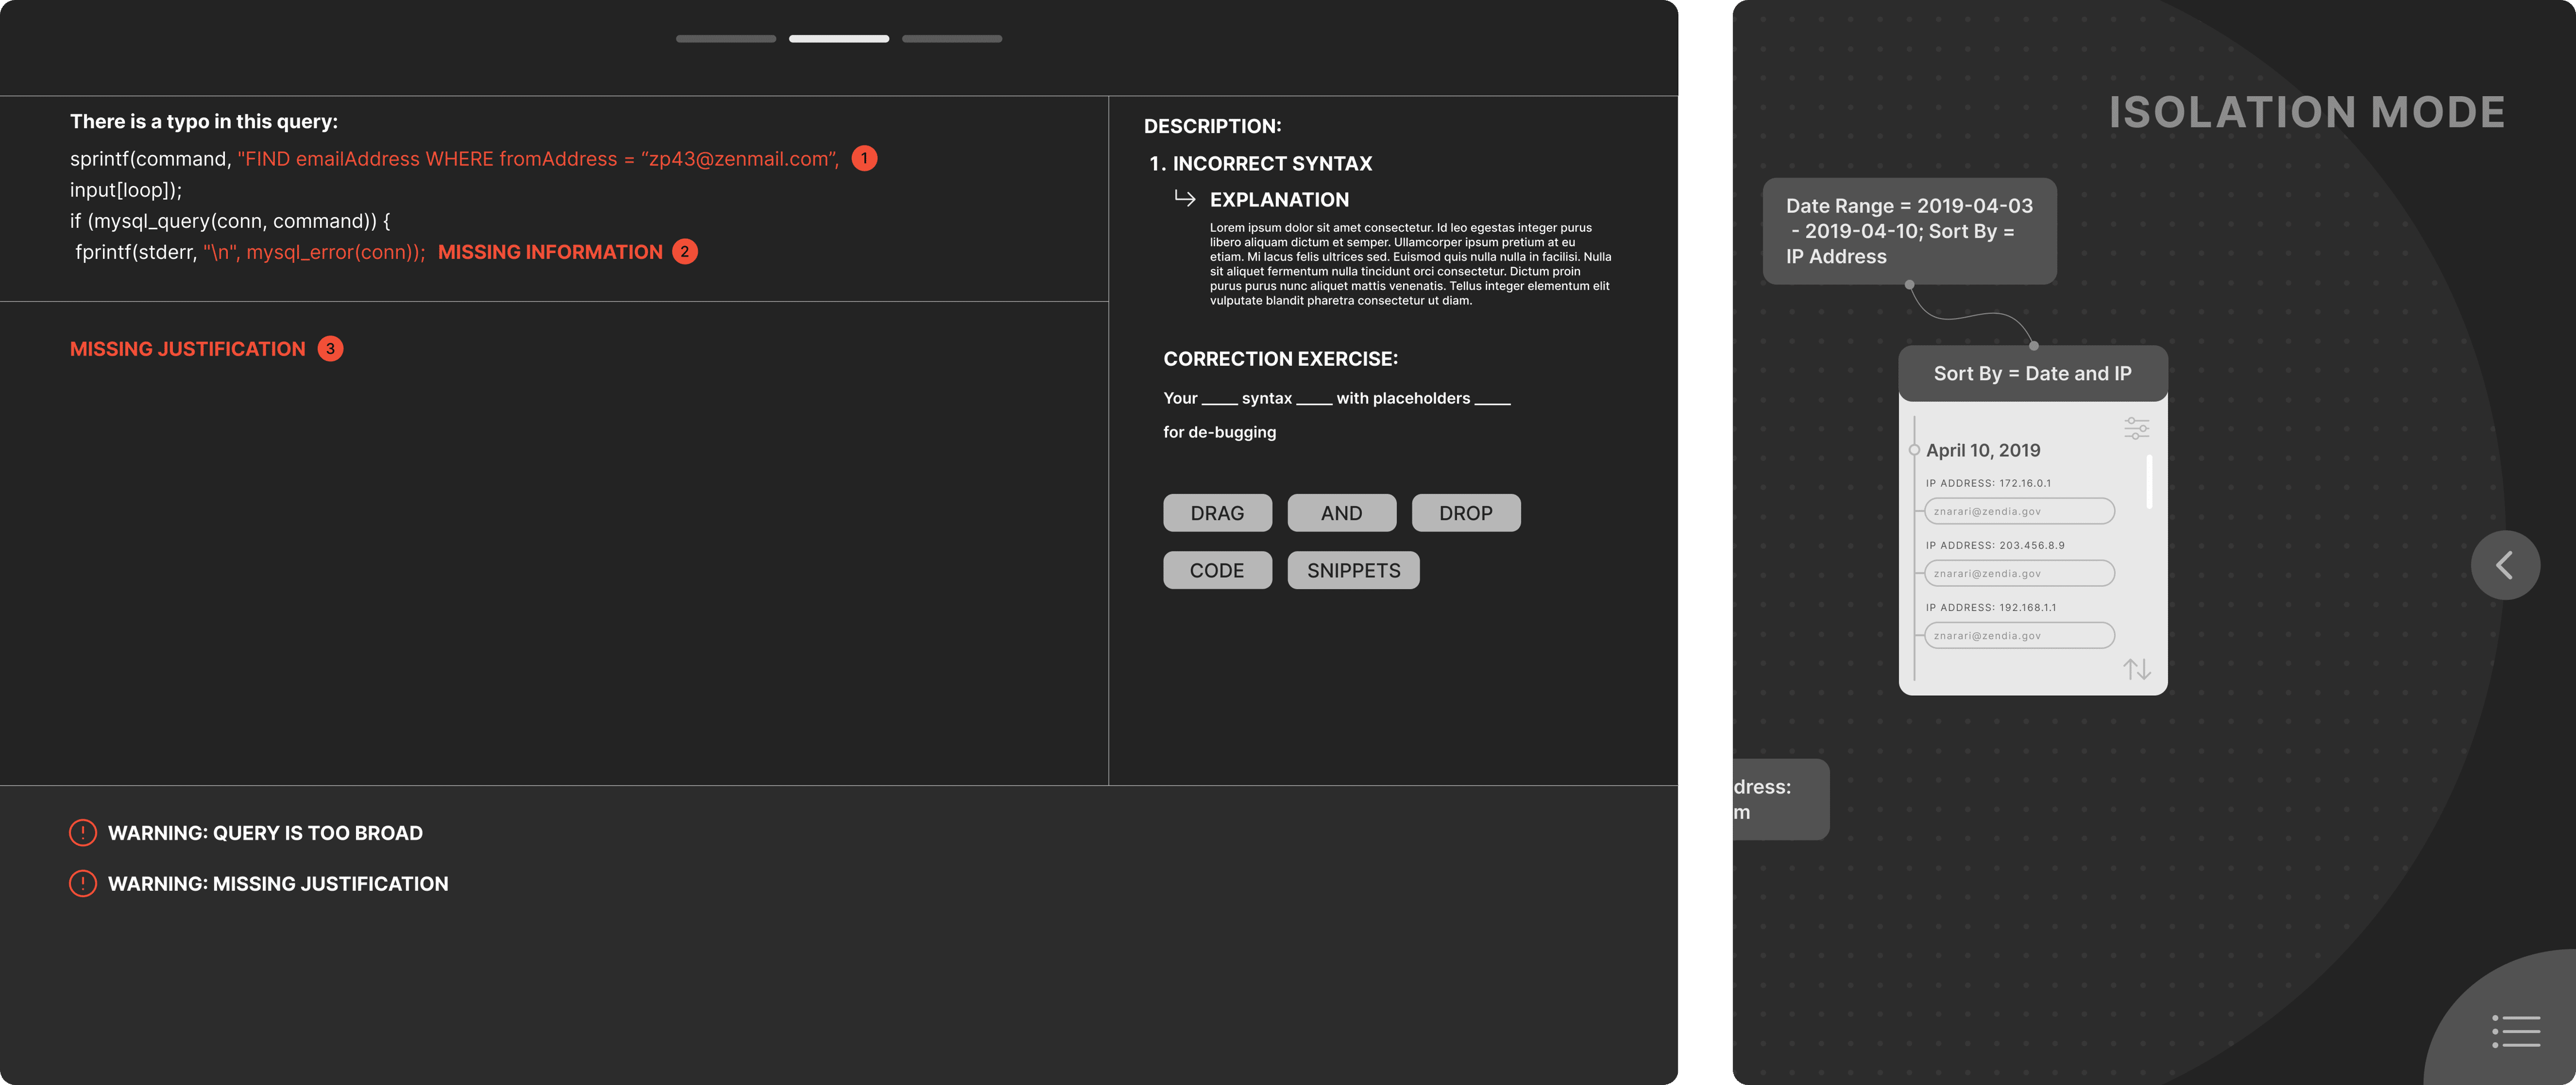
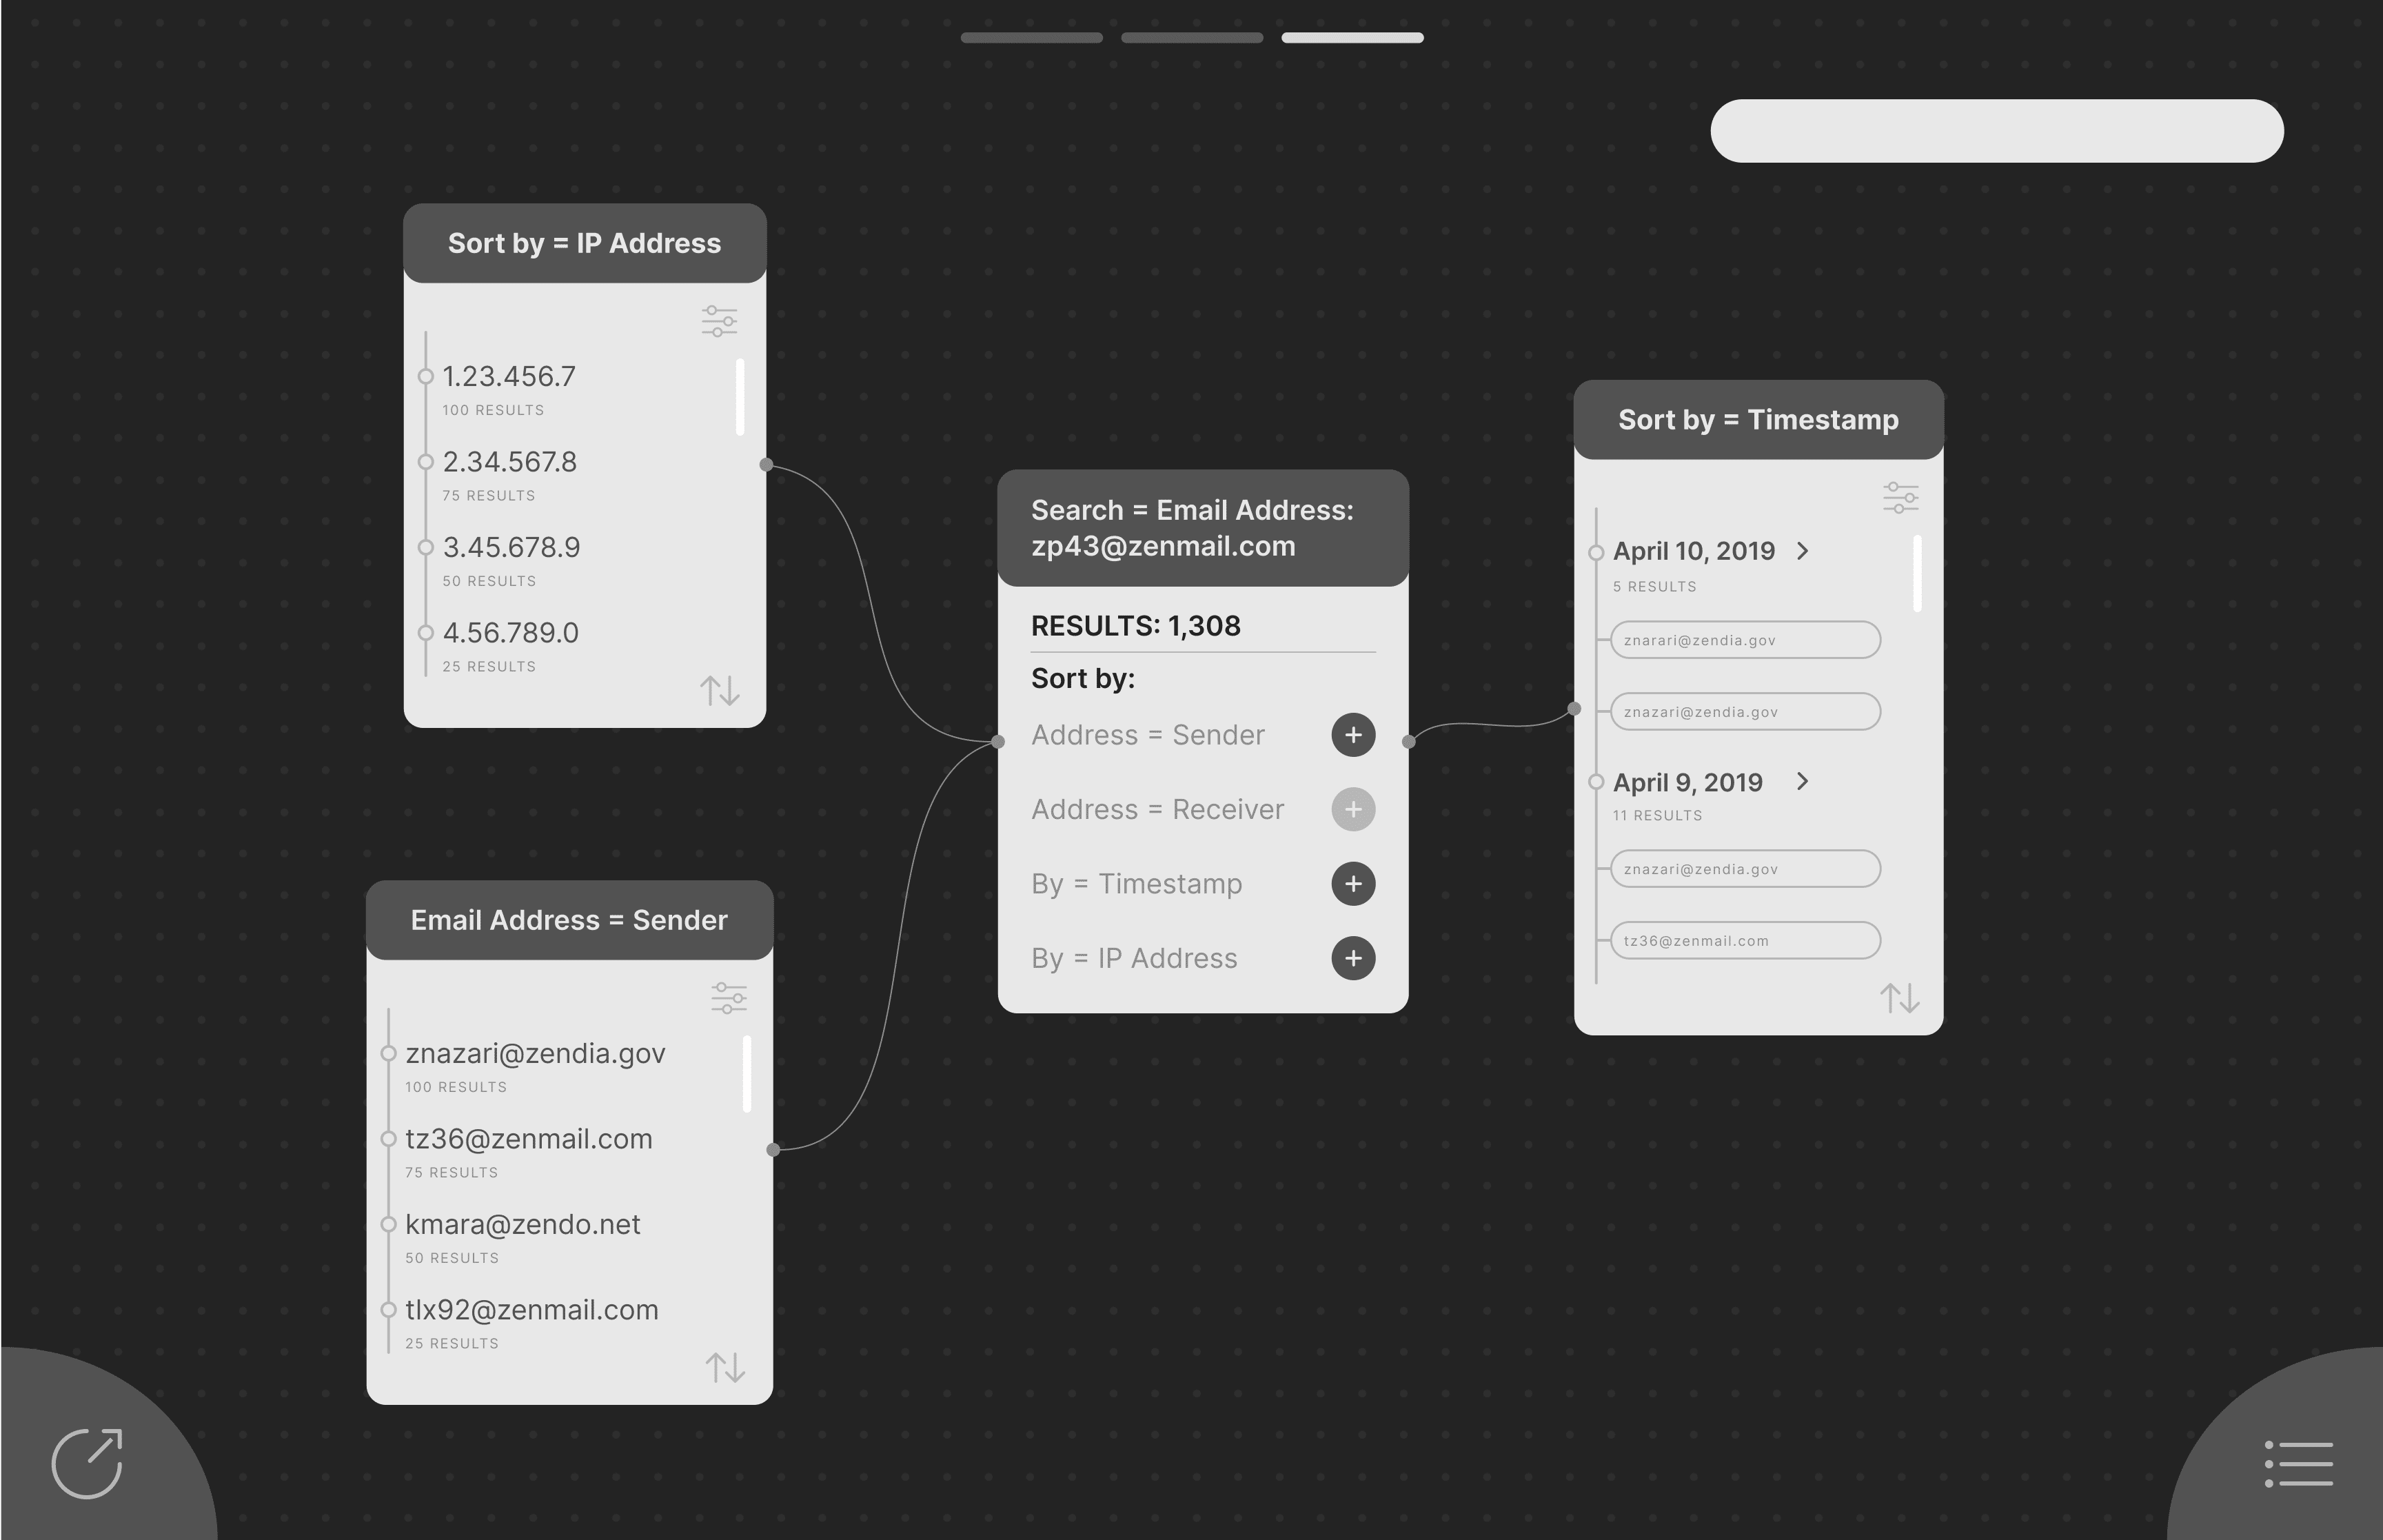
Fluid Node System
Segments and visualizes the analysis process to help reduce cognitive load.Isolation mode allows the analyst to isolate their search process and drill down into query results.
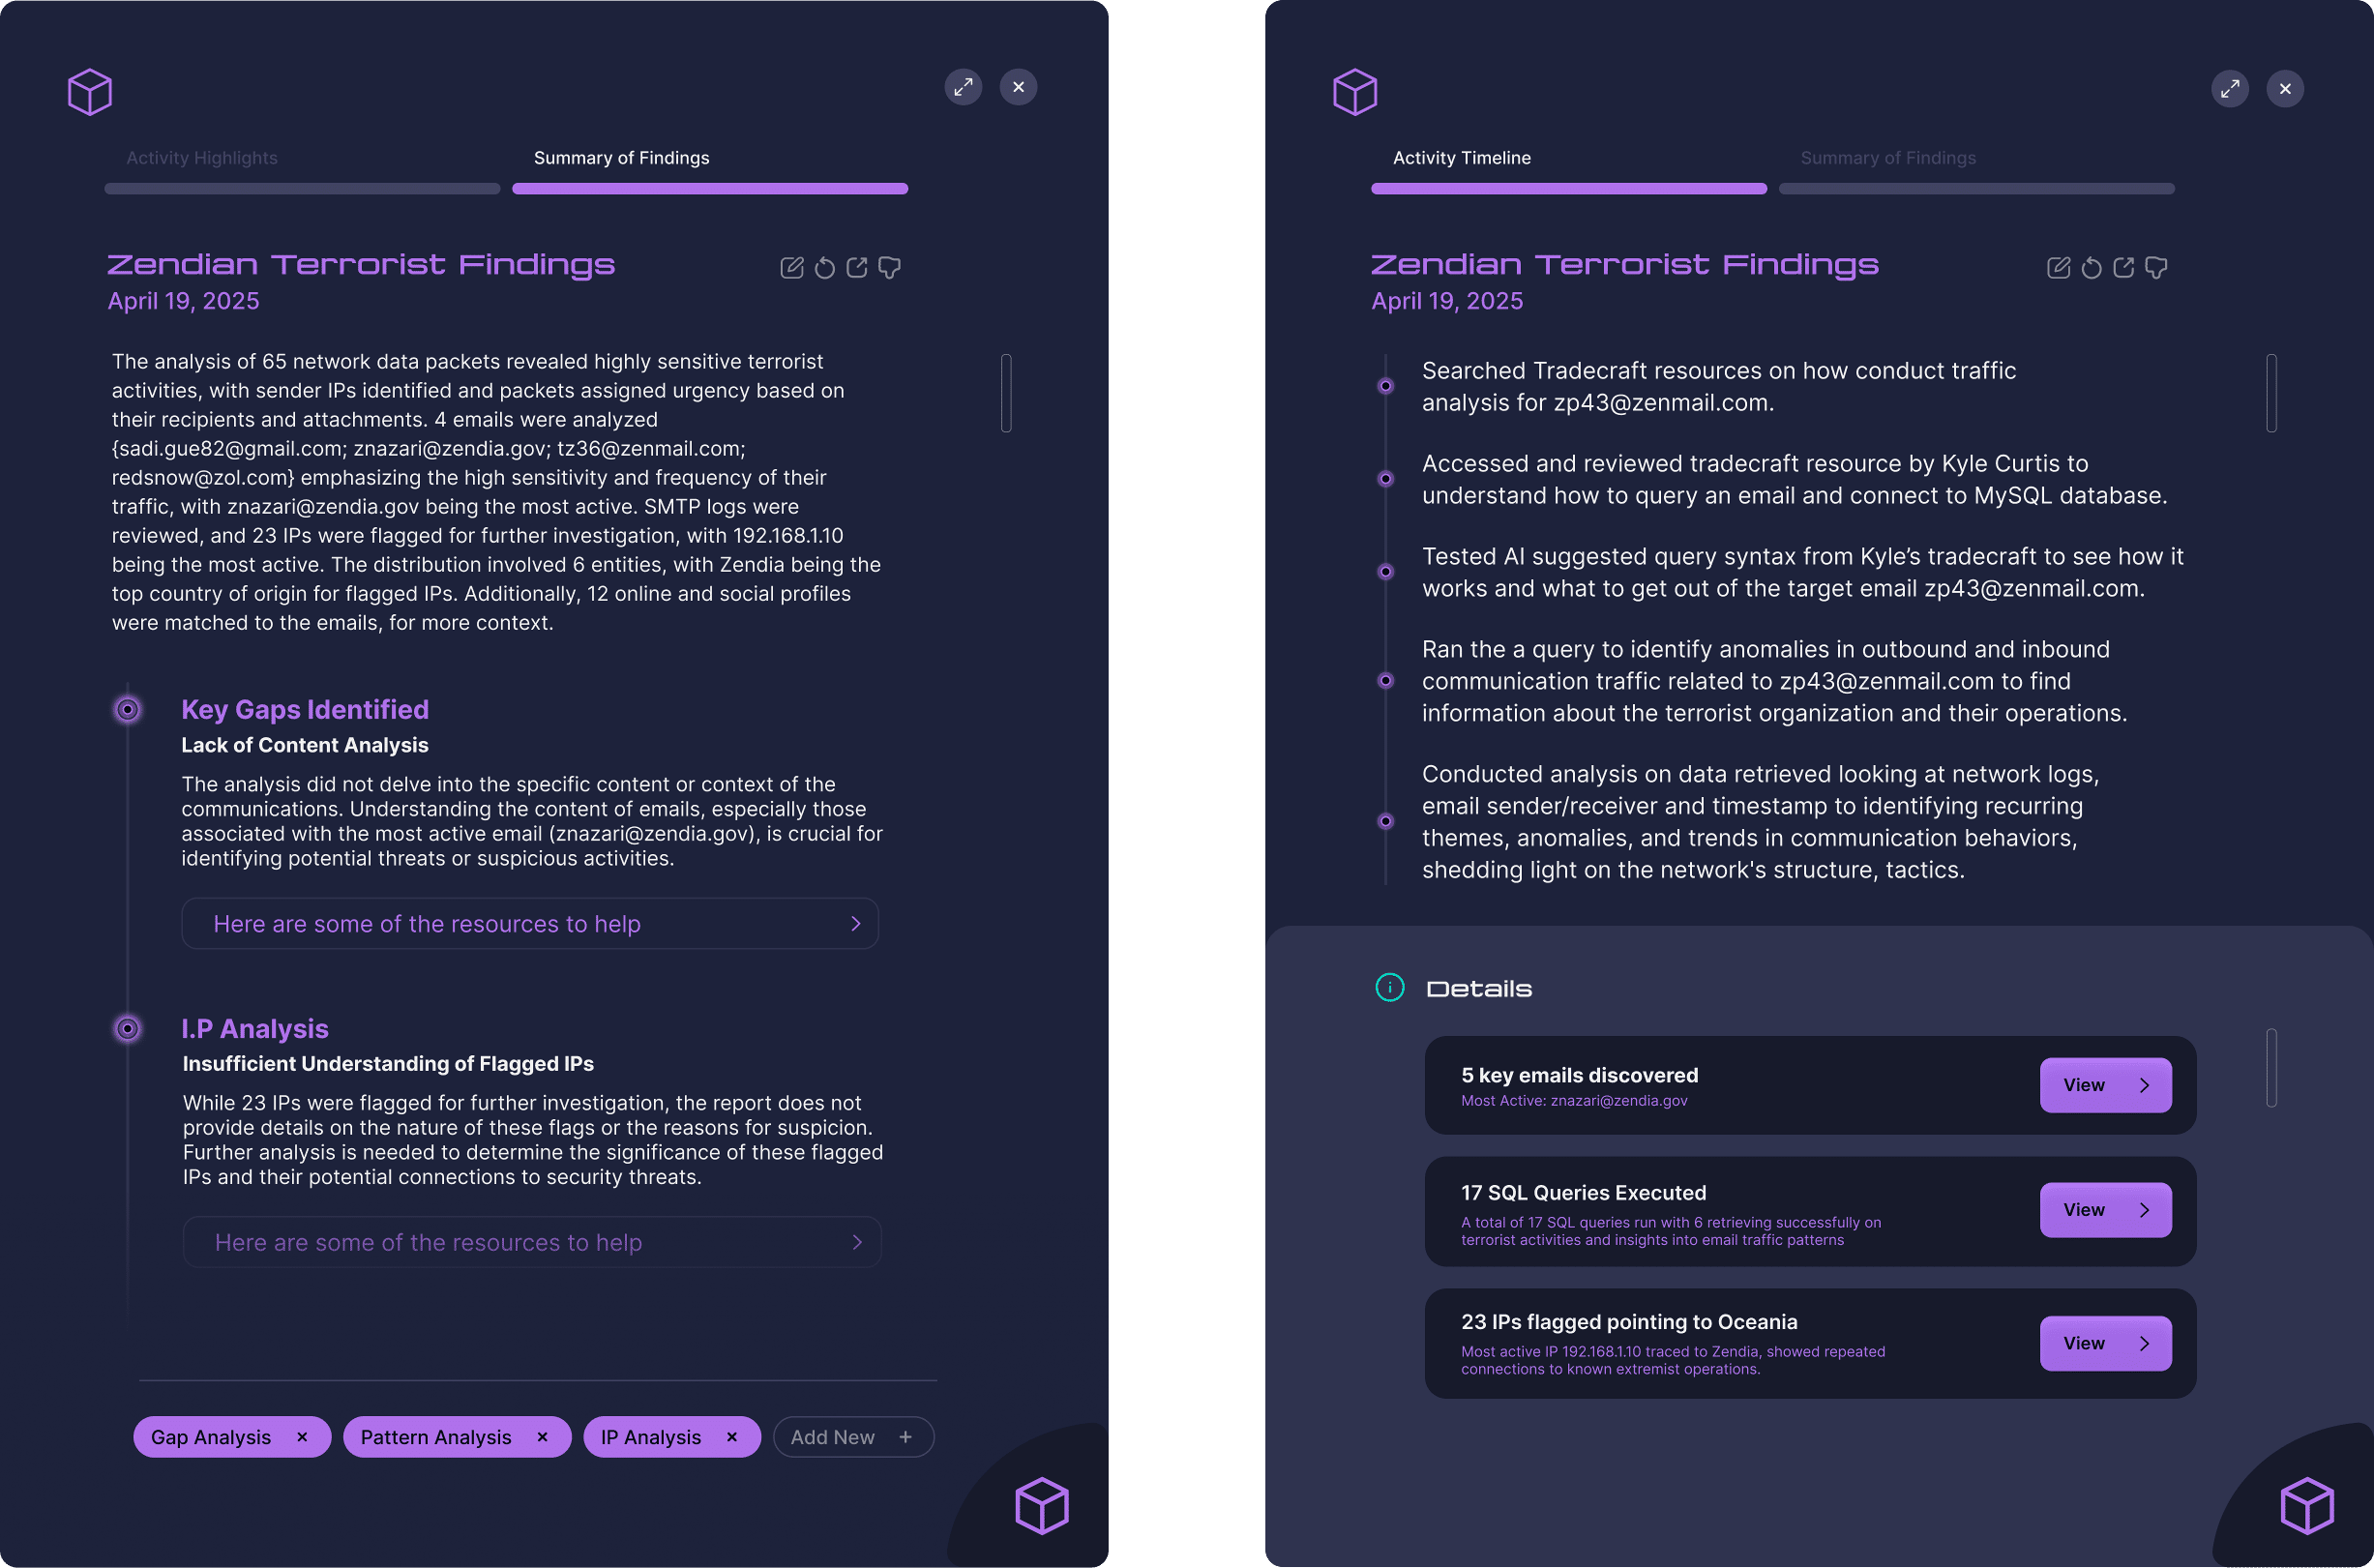
Data Basket
Drag-and-drop feature helps analysts document findings throughout their workflow.AI-generated insights condenses data and analysis into concise narratives.
ProcessBenchmarking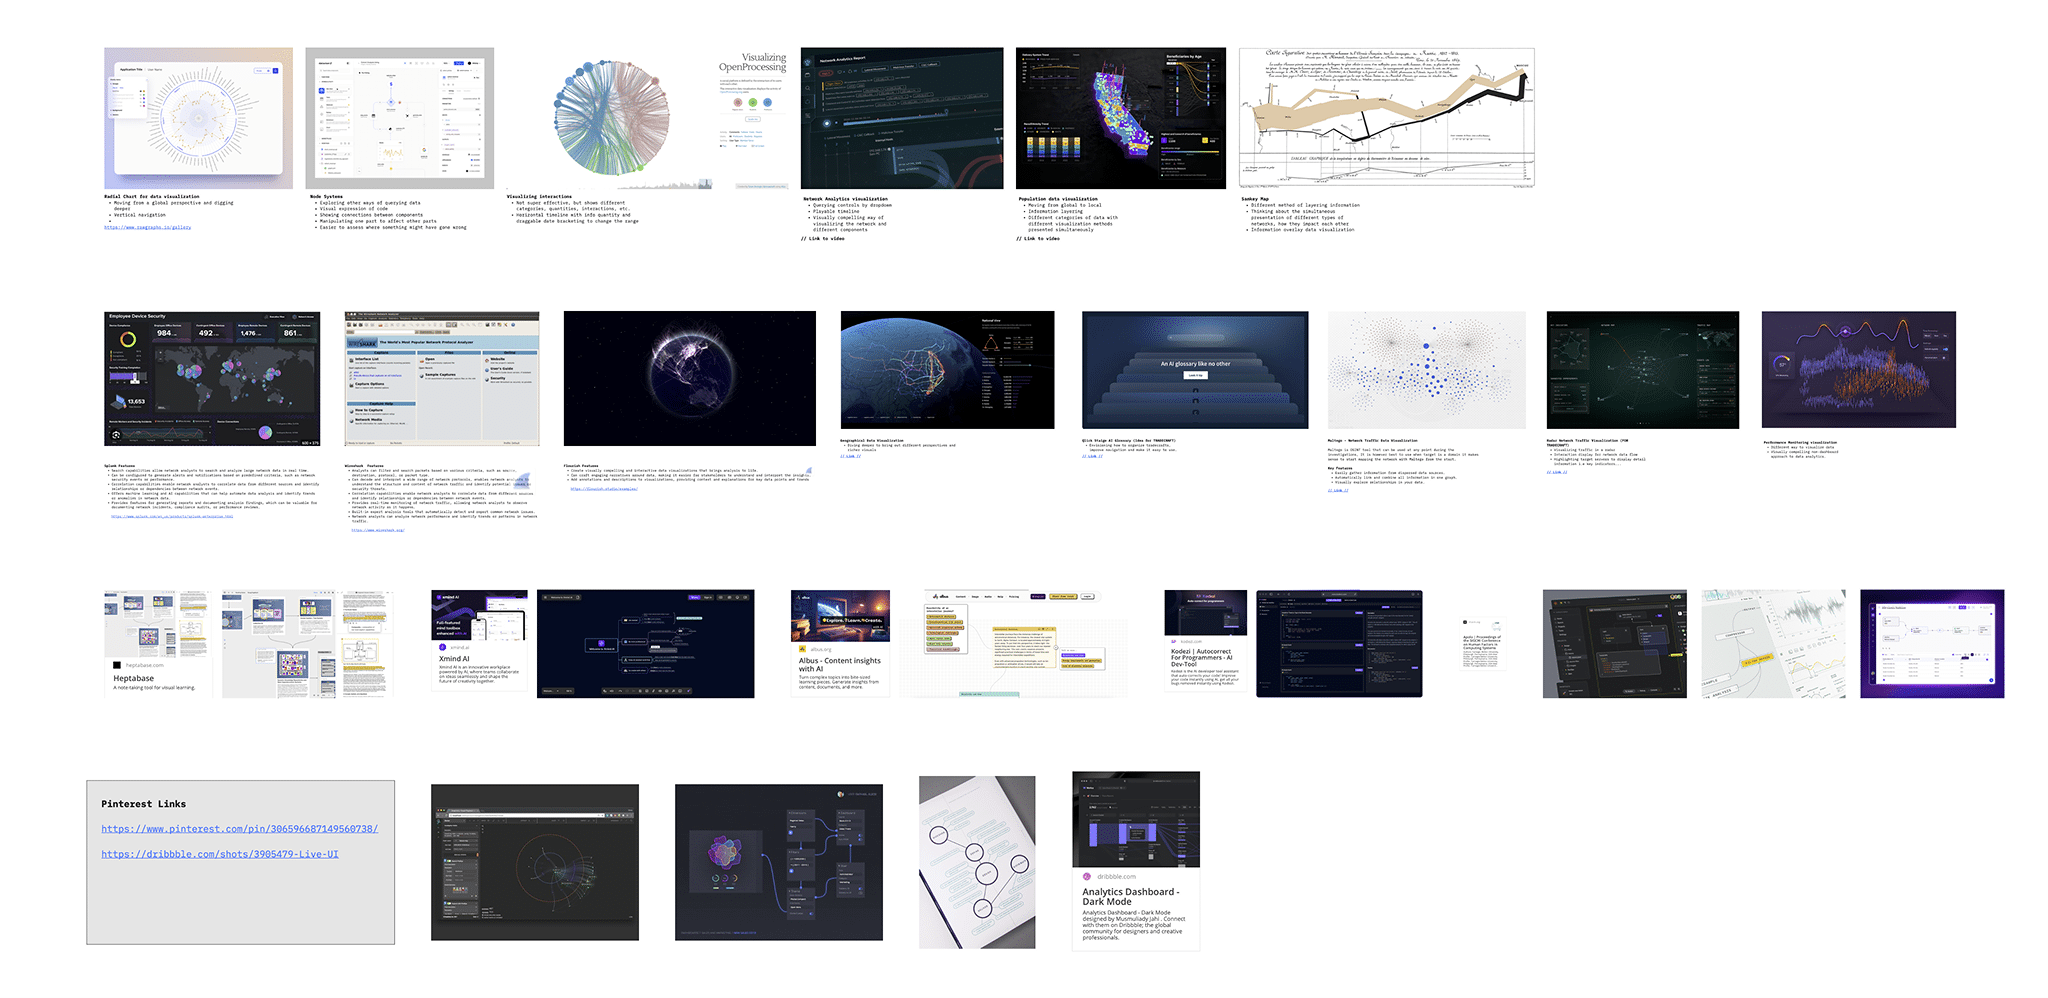
We began by conducting benchmarking to evaluate and compare products specializing in data visualization and analysis.This process provided insights into existing tools, methods, and capabilities, serving as a foundation for developing our speculative interface.
User ResearchInterview InsightsWe interviewed analysts to understand their workflow. We spoke specifically with novice analysts, uncovering common pain points, opportunities, desires and motivators.
Pain Points
High learning curve: Requires significant time and effort to learn querying syntax.Compliance uncertainty: Unclear legal guidelines create stress and hesitation.Data Analysis: Difficulty interpreting the meaning of data and connecting it to actionable insights.
Opportunities
Guided workflows: Explaining the "why" behind tasks to improve comprehension.Knowledge sharing: Create opportunities for analysts to share best practices, bridging gaps in independent learning.Intuitive visualizations: Tools that present data relationships, gaps, and patterns in a simple, digestible way.
Desires and Motivators
Success and impact: The satisfaction of making meaningful discoveries and providing actionable intelligence.Clarity and efficiency: Tools that simplify querying, interpreting, and organizing data.Autonomy: Confidence to make decisions and complete tasks independently.
Persona and ScenarioThe insights from our interviews helped inform our persona and scenario.
Susie is a brand new TDNA at the Big Government Intelligence Agency (BGIA) and has just been assigned to her first development tour. For the next few weeks she is working with the Zendian team looking at a Zendian terrorist group for possible connections to a bombing in the country of Macondo. She has a bachelor’s degree in International Relations and no knowledge of global telecommunications.After spending her first two weeks in training, Susie arrives for her first day in the counterterrorism organization within BGIA. Her mentor tasks her with querying an email address and analyzing recent traffic. The identified target has recently been in communication with the terrorist group. The BGIA suspects the address belongs to a new operative.
Pain Points
- Is this right? Struggles to draft queries due to limited technical knowledge.
- Proceed with caution! Worried about drafting queries and maintaining compliance.
- Now what? Difficulty interpreting technical data and acting on information.
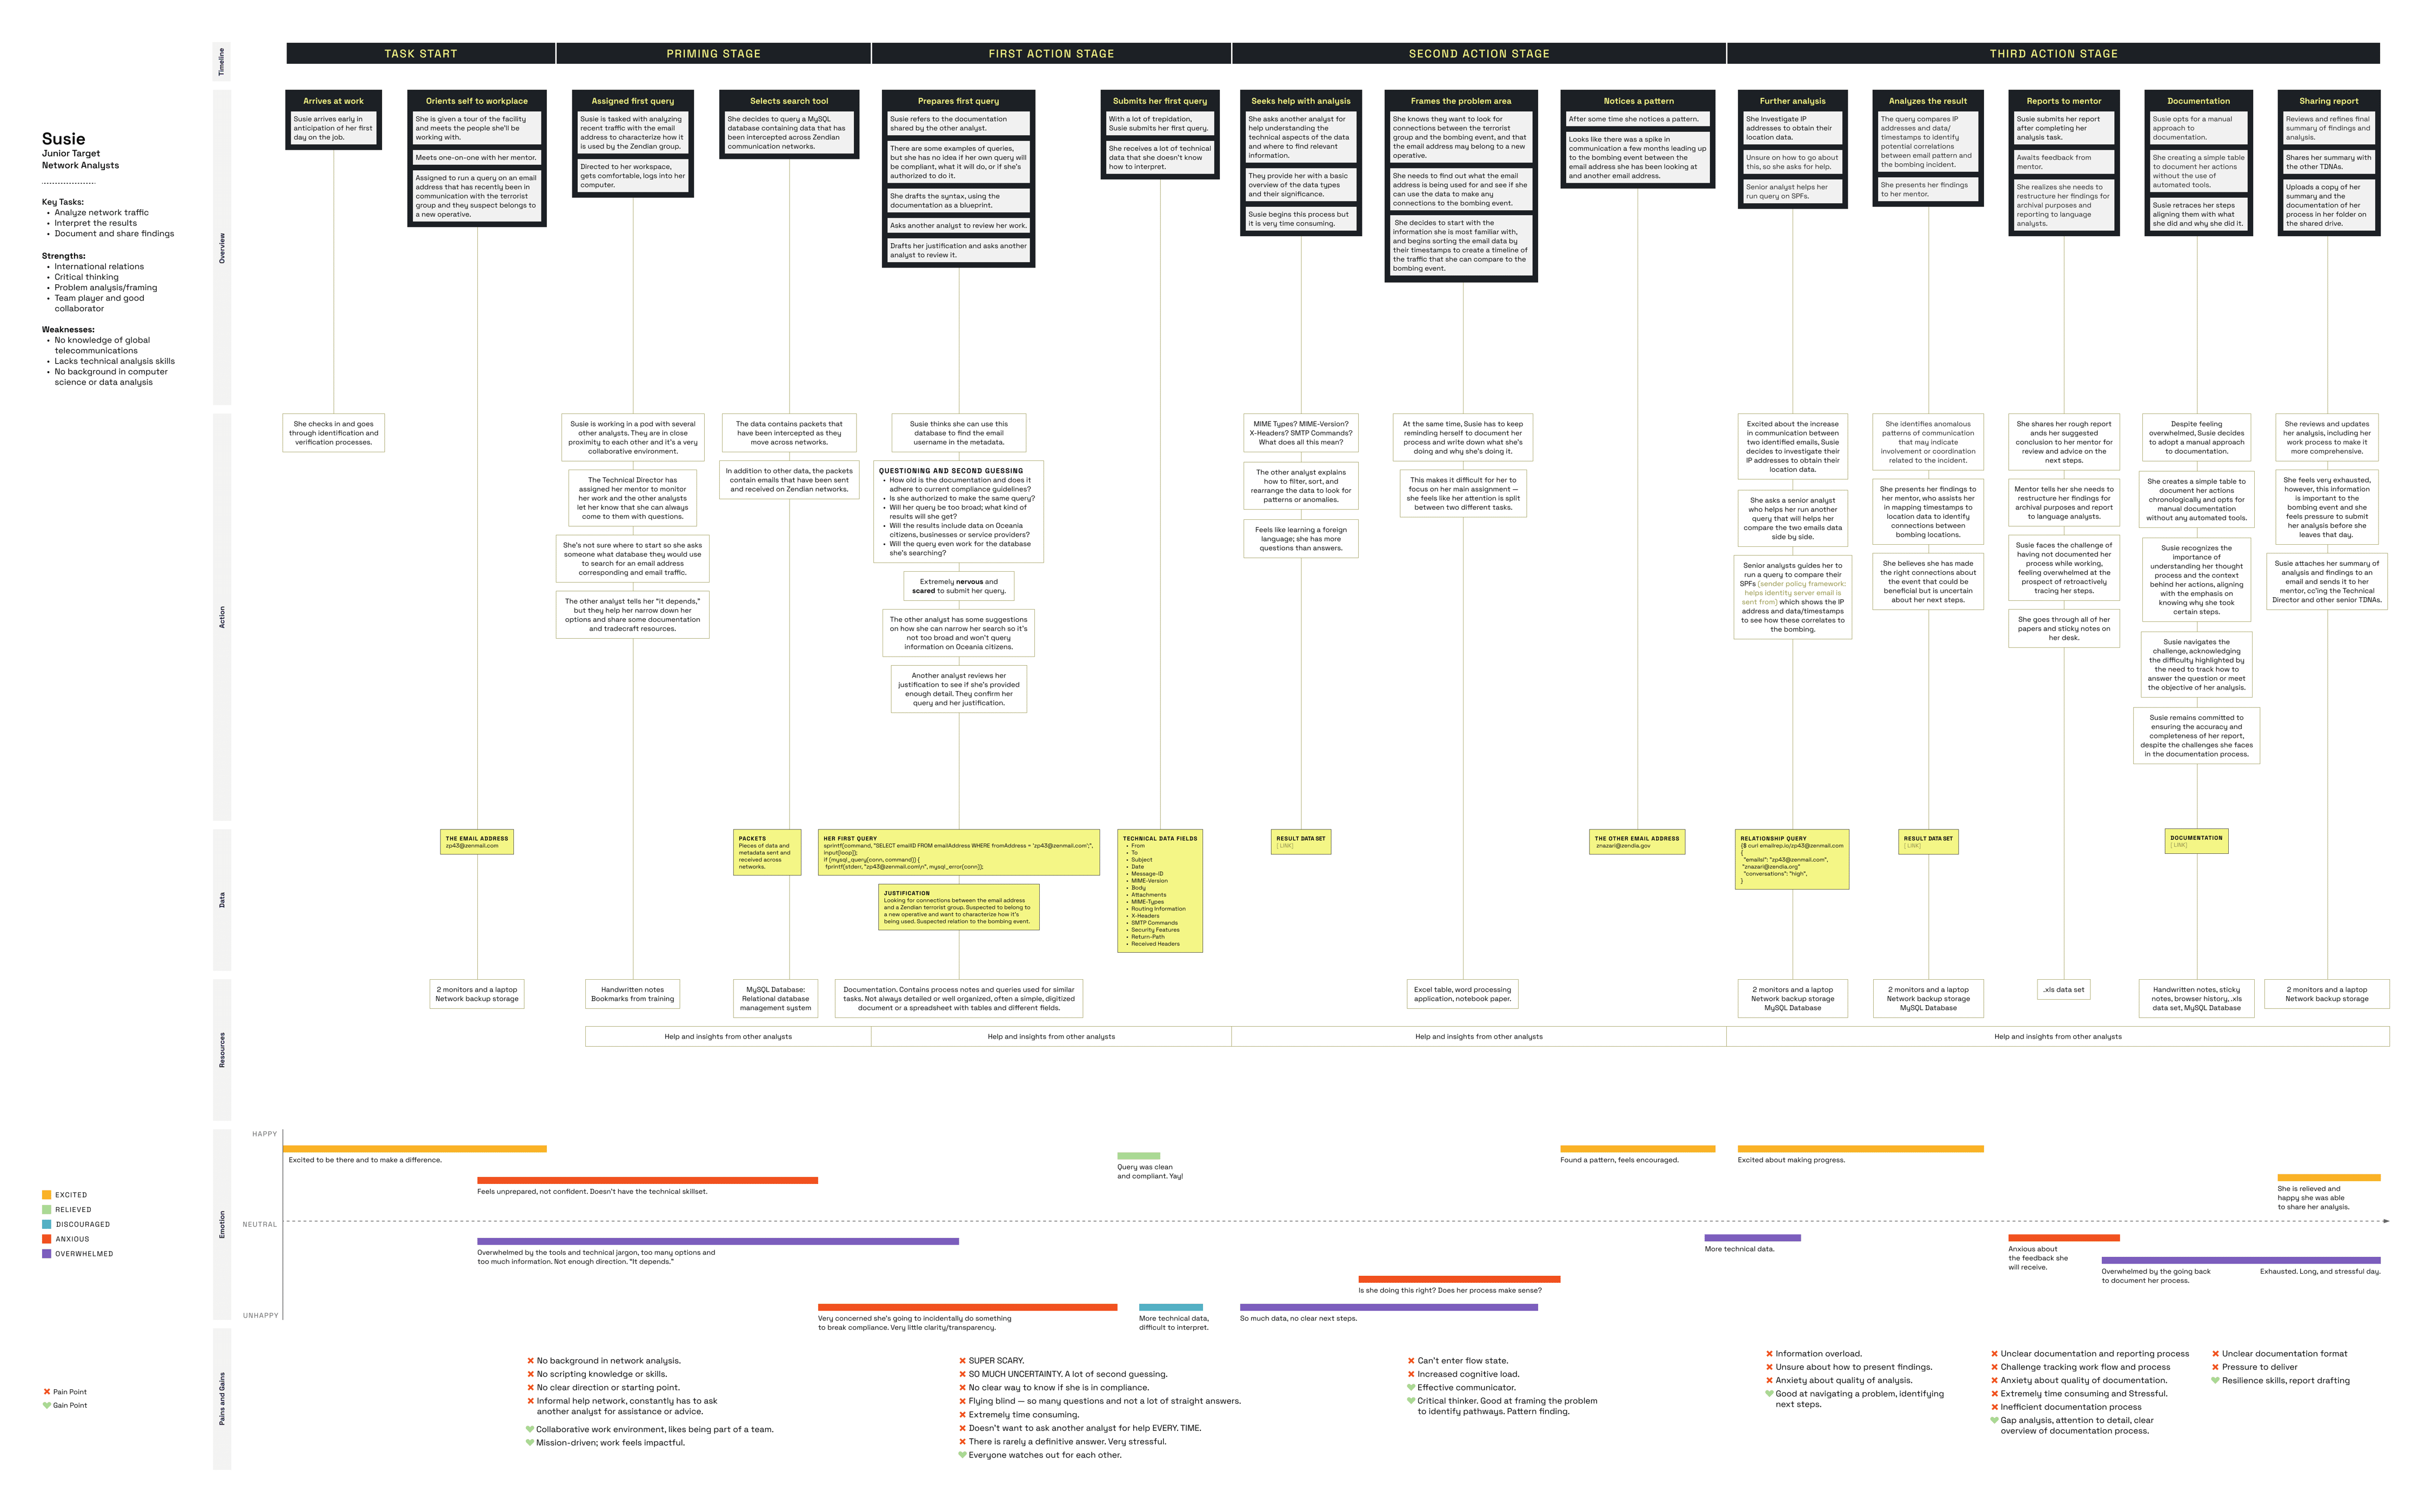
User Journey Mapping
The user interviews helped break down the current user journey into five key phases —orientation, problem framing, exploration, query execution, analysis, and documentation.The pain points identified all reflected a broader issue of cognitive and operational overload in high-stakes, complex environments. With this in mind, we anticipated that effective interventions would include streamlined analysis, educational tools, accessible resources, and adaptive visualizations.
Concept DevelopmentLow-Fidelity WireframesMy initial sketches allowed me to start transforming feature ideas into tangible concepts.
Inspired by common code editors, I envisioned a sandbox system where analysts could experiment with syntax in a low-stakes environment. An AI-powered learning module would educate novices without reducing their engagement in the task.To support data analysis for junior analysts, I envisioned a node tree system that progressively discloses information and helps analysts segment data in manageable chunks. "Isolation mode" was designed to allow analysts to run subqueries within a dataset, streamlining their search.
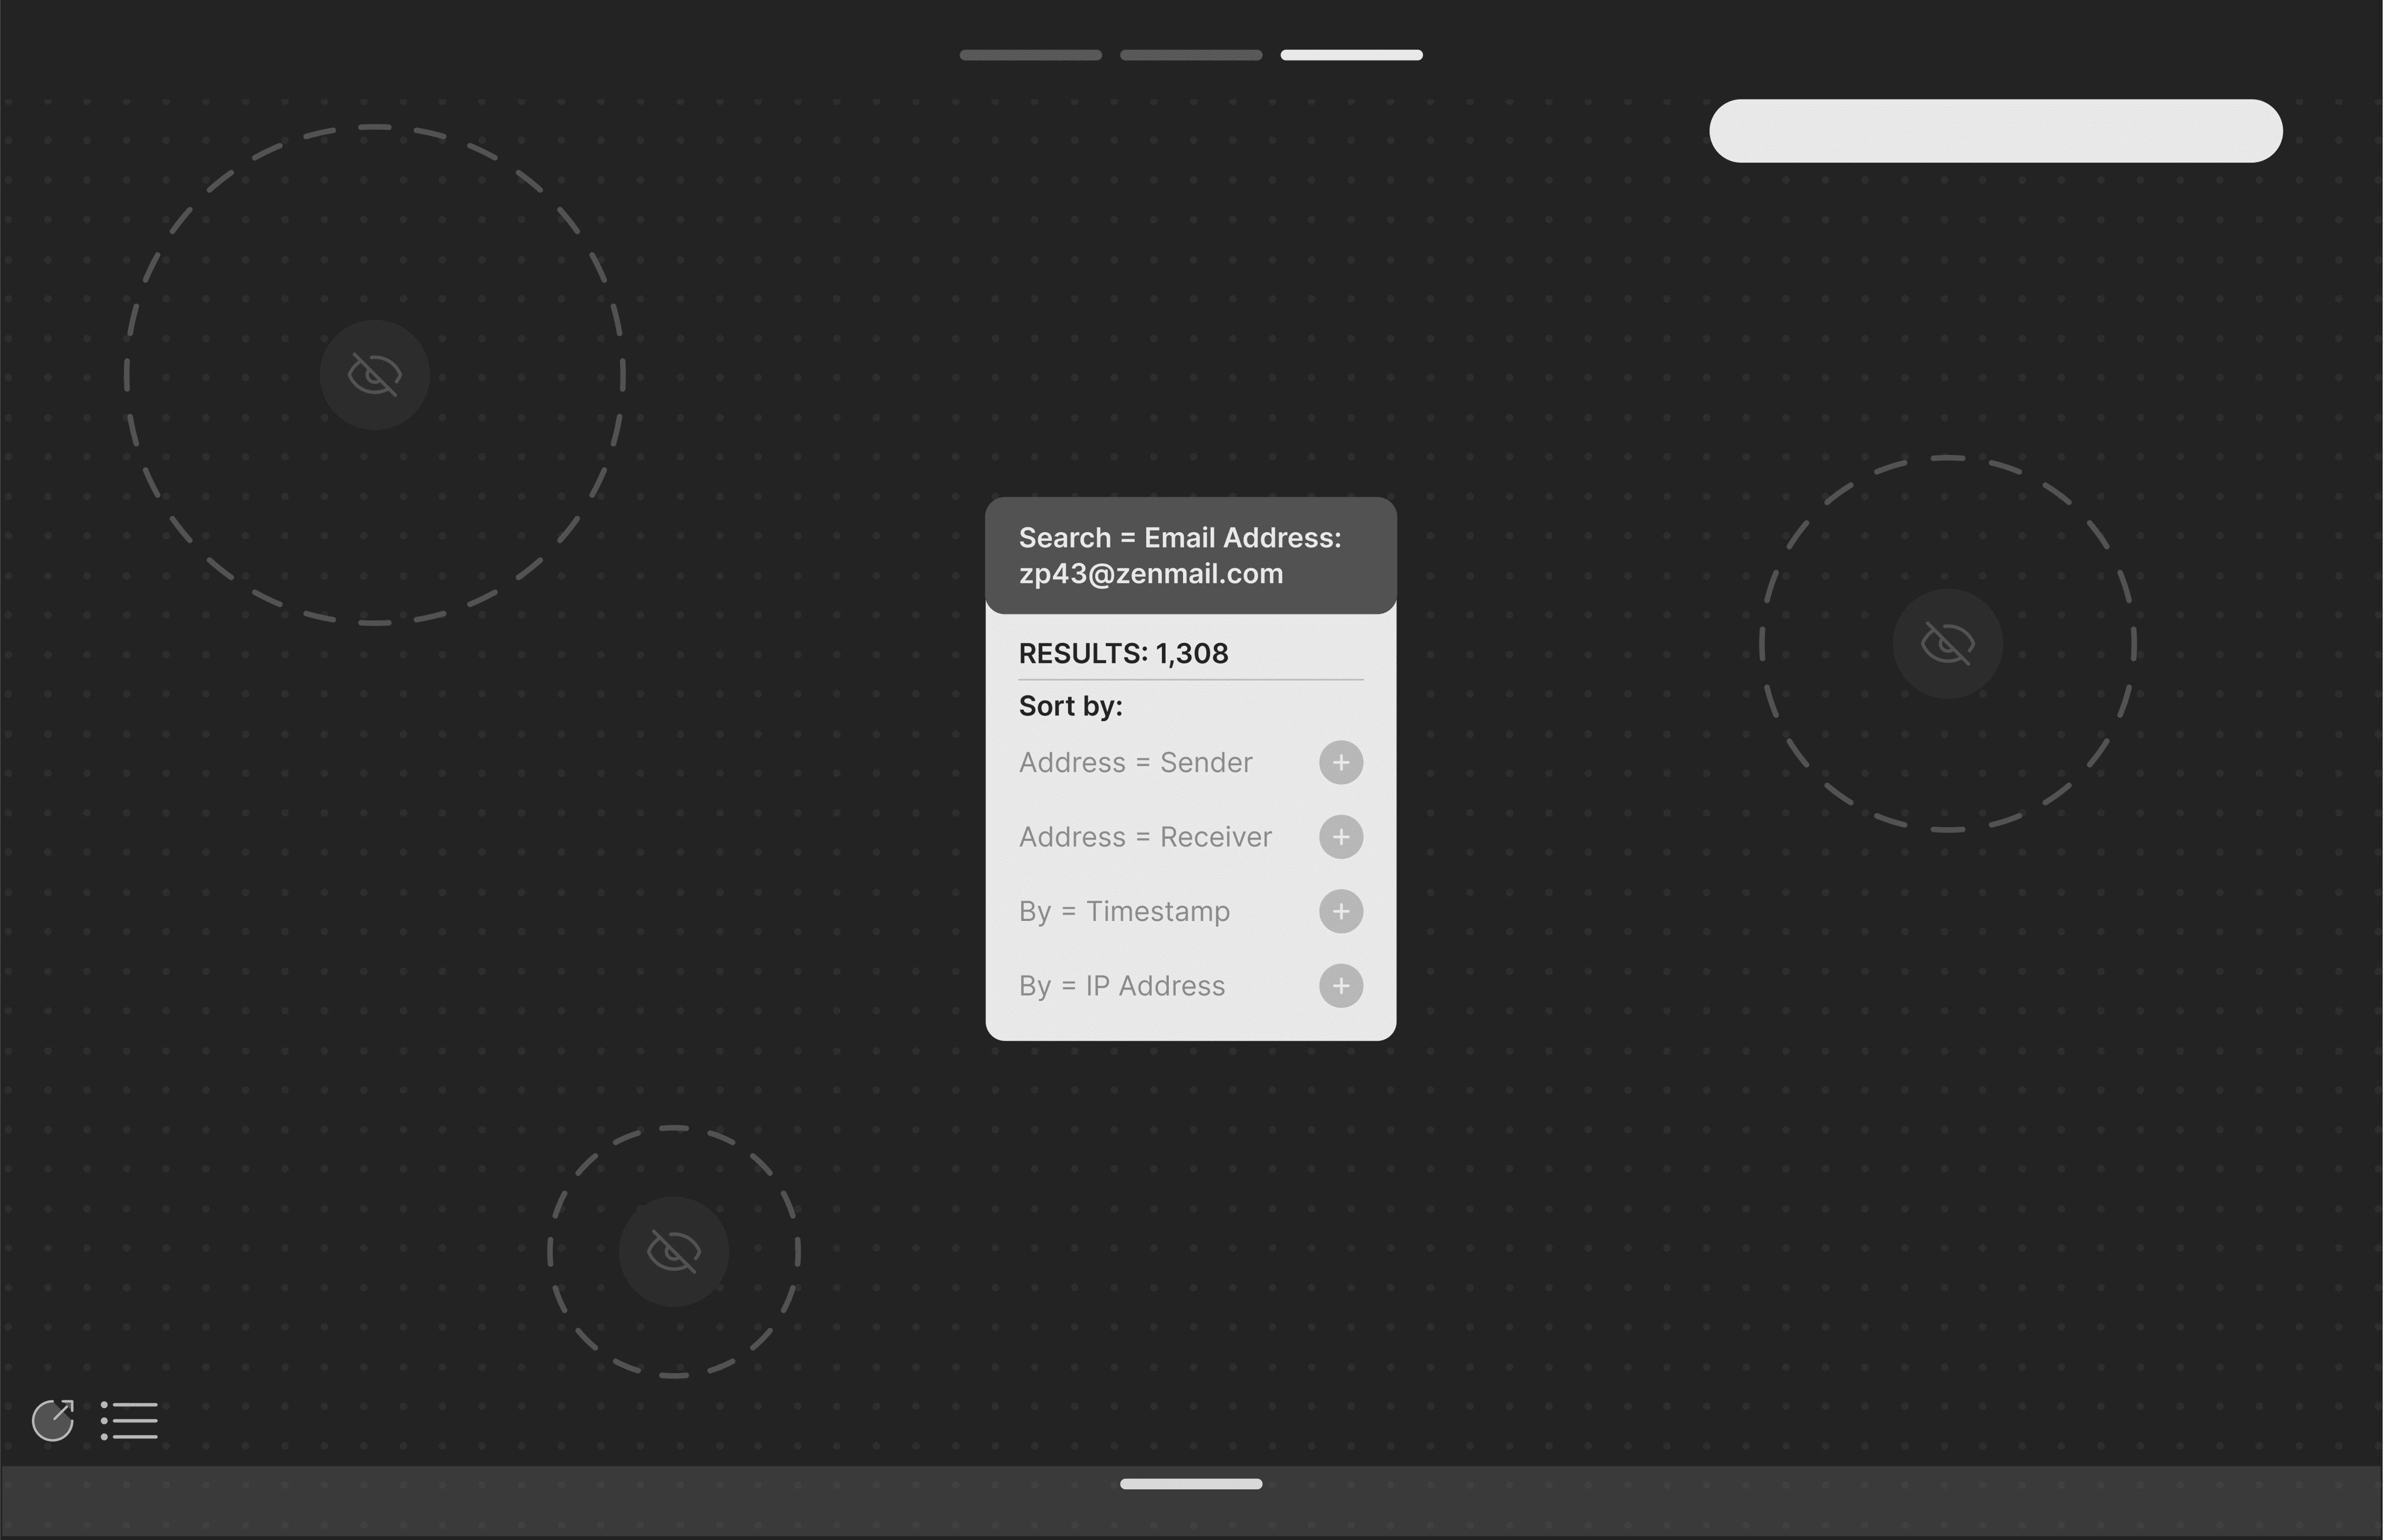
Mid-Fidelity Wireframes
My initial concepts for the node tree system incorporated the idea of “hidden” data. The system would initially only display data points interpretable by novice analysts, with the rest blurred or collapsed until further analysis was conducted.During feedback sessions, analysts felt the omission created unnecessary questions about what was missing, complicating the analysis process.
Analysts responded well to the sandbox and isolation mode.Suggested improvements included adding an autocorrect feature and creating a visual distinction between isolation mode and the default interface.
In the data analysis stage, analysts responded well to to the node tree system but desired greater flexibility to visualize data in different modalities.
High-Fidelity PrototypesThis feedback informed the development of our high-fidelity screens.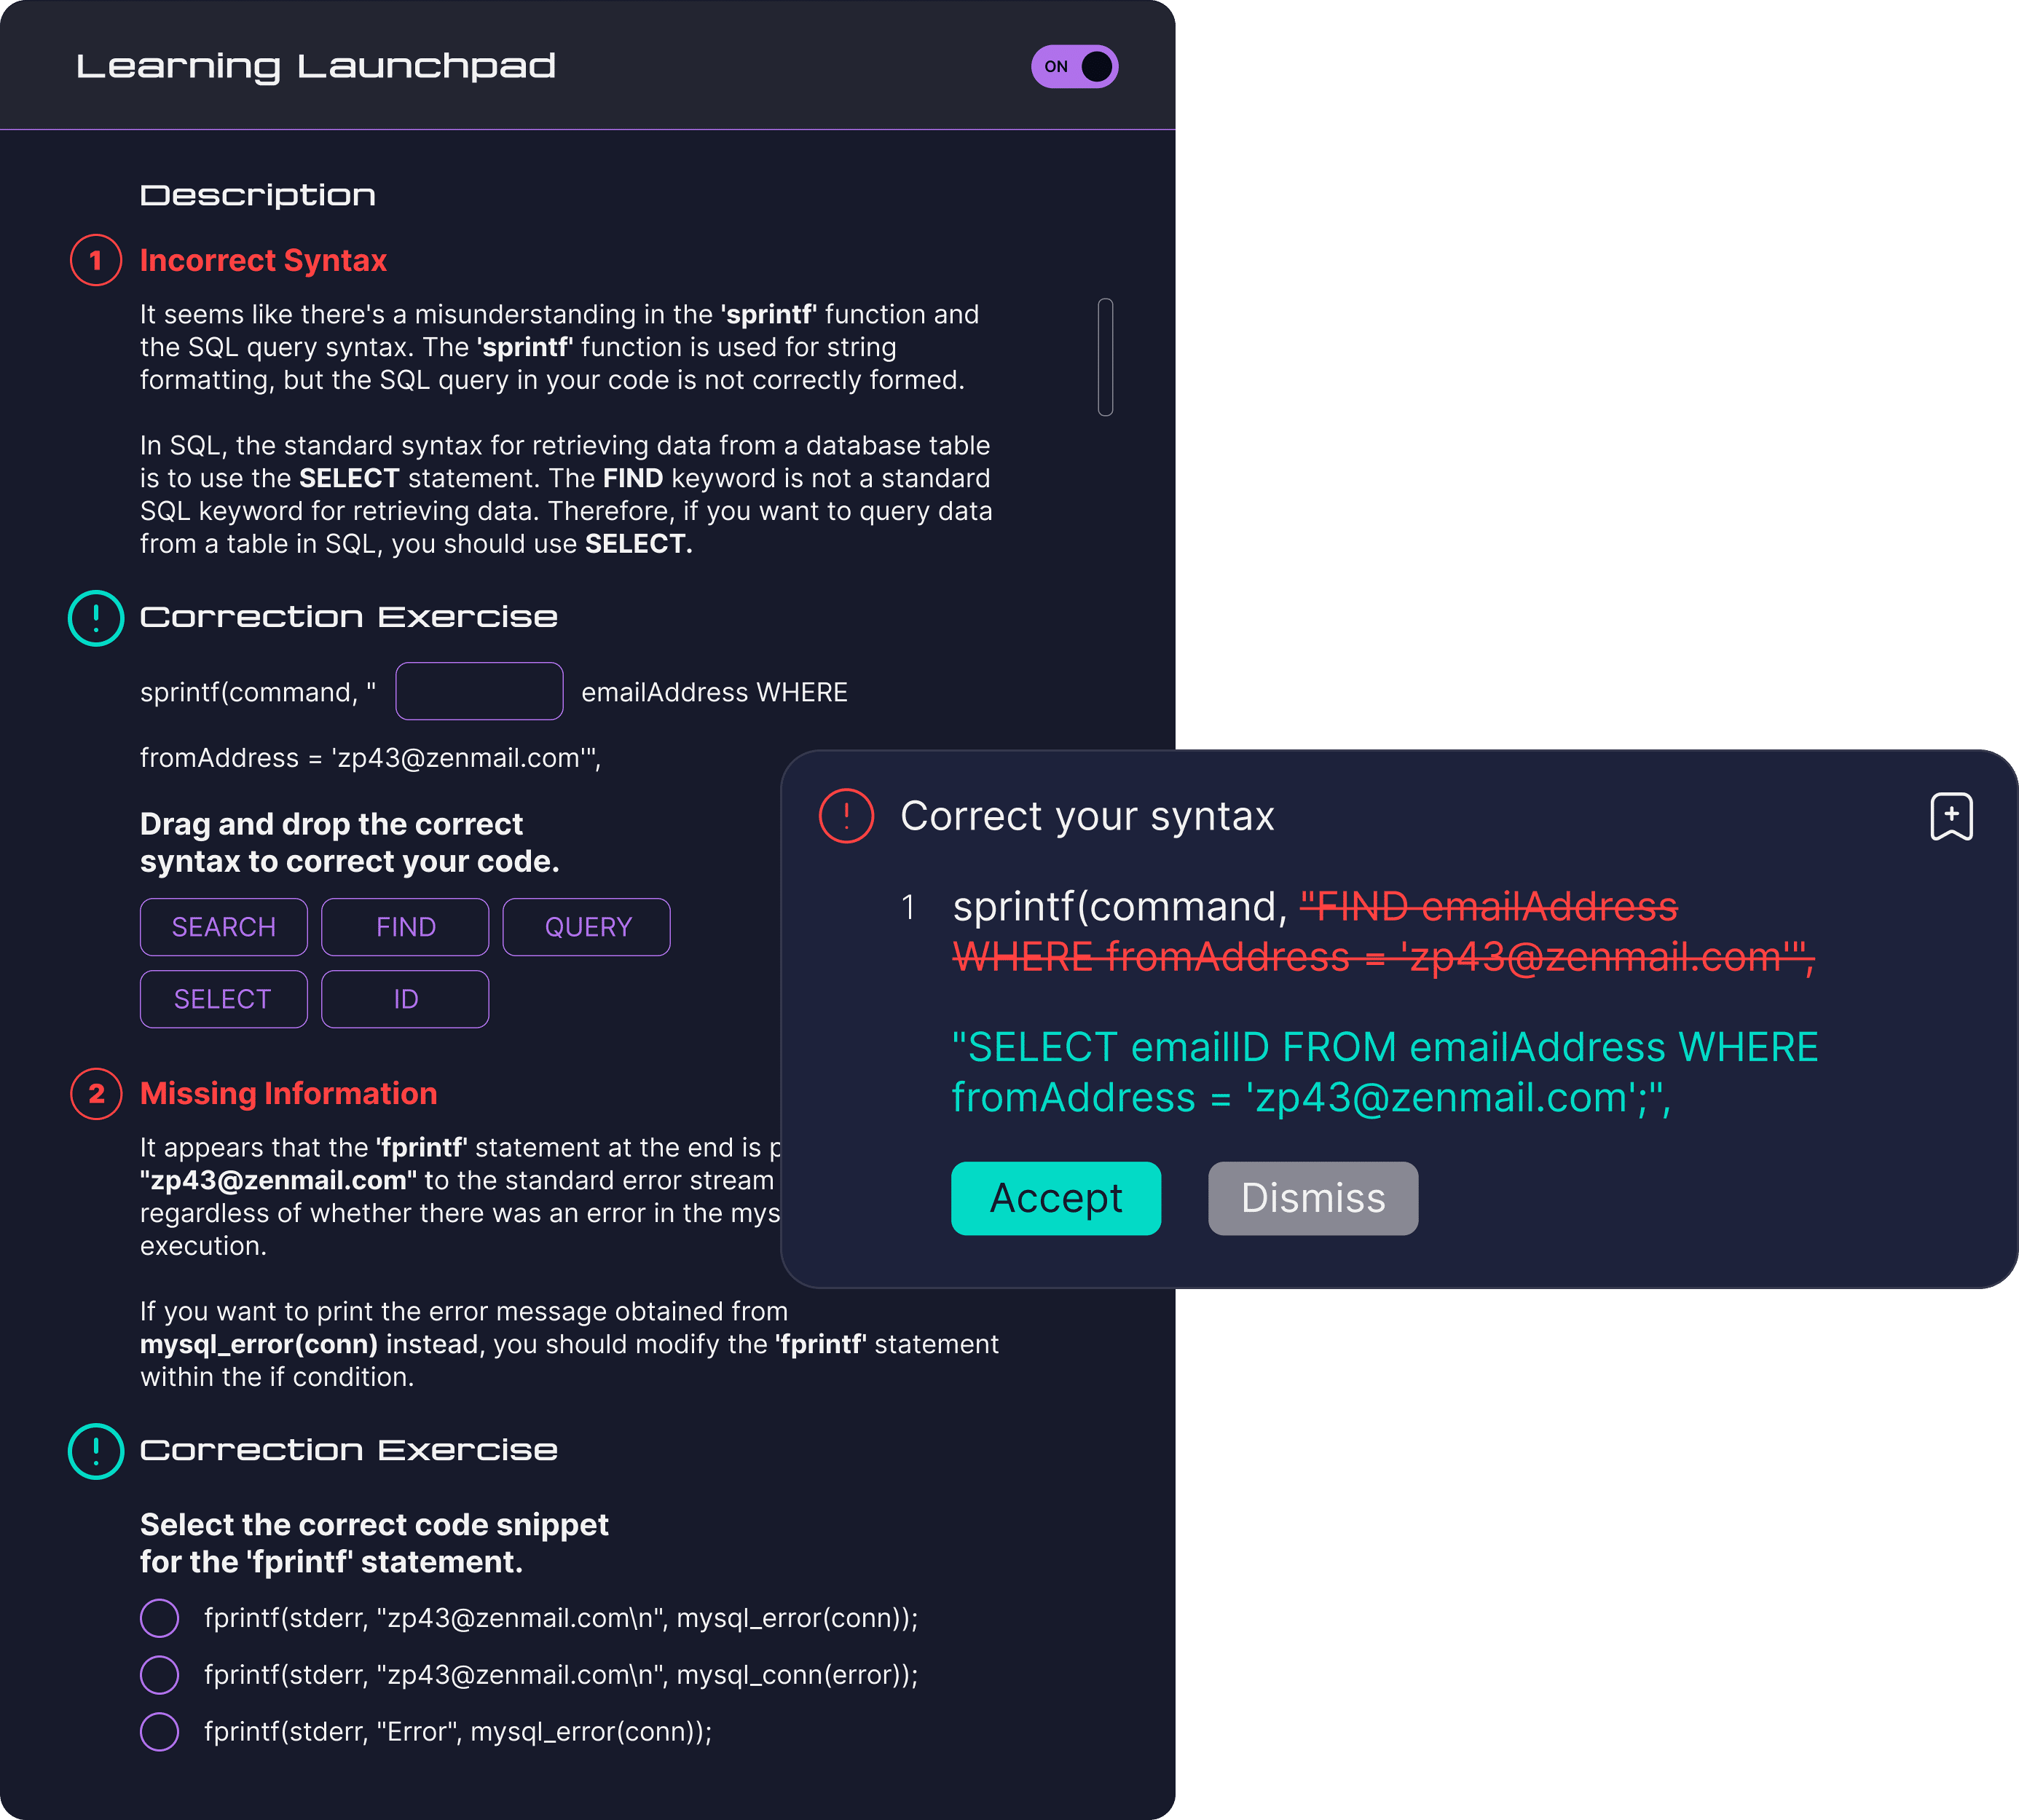
In the querying sandbox, I balanced the needs of advanced and novice analysts by developing a distinct Learning Launchpad panel.Advanced analysts could toggle it off for efficient syntax correction using autocorrect, while novice analysts could toggle it on for guided correction exercises.
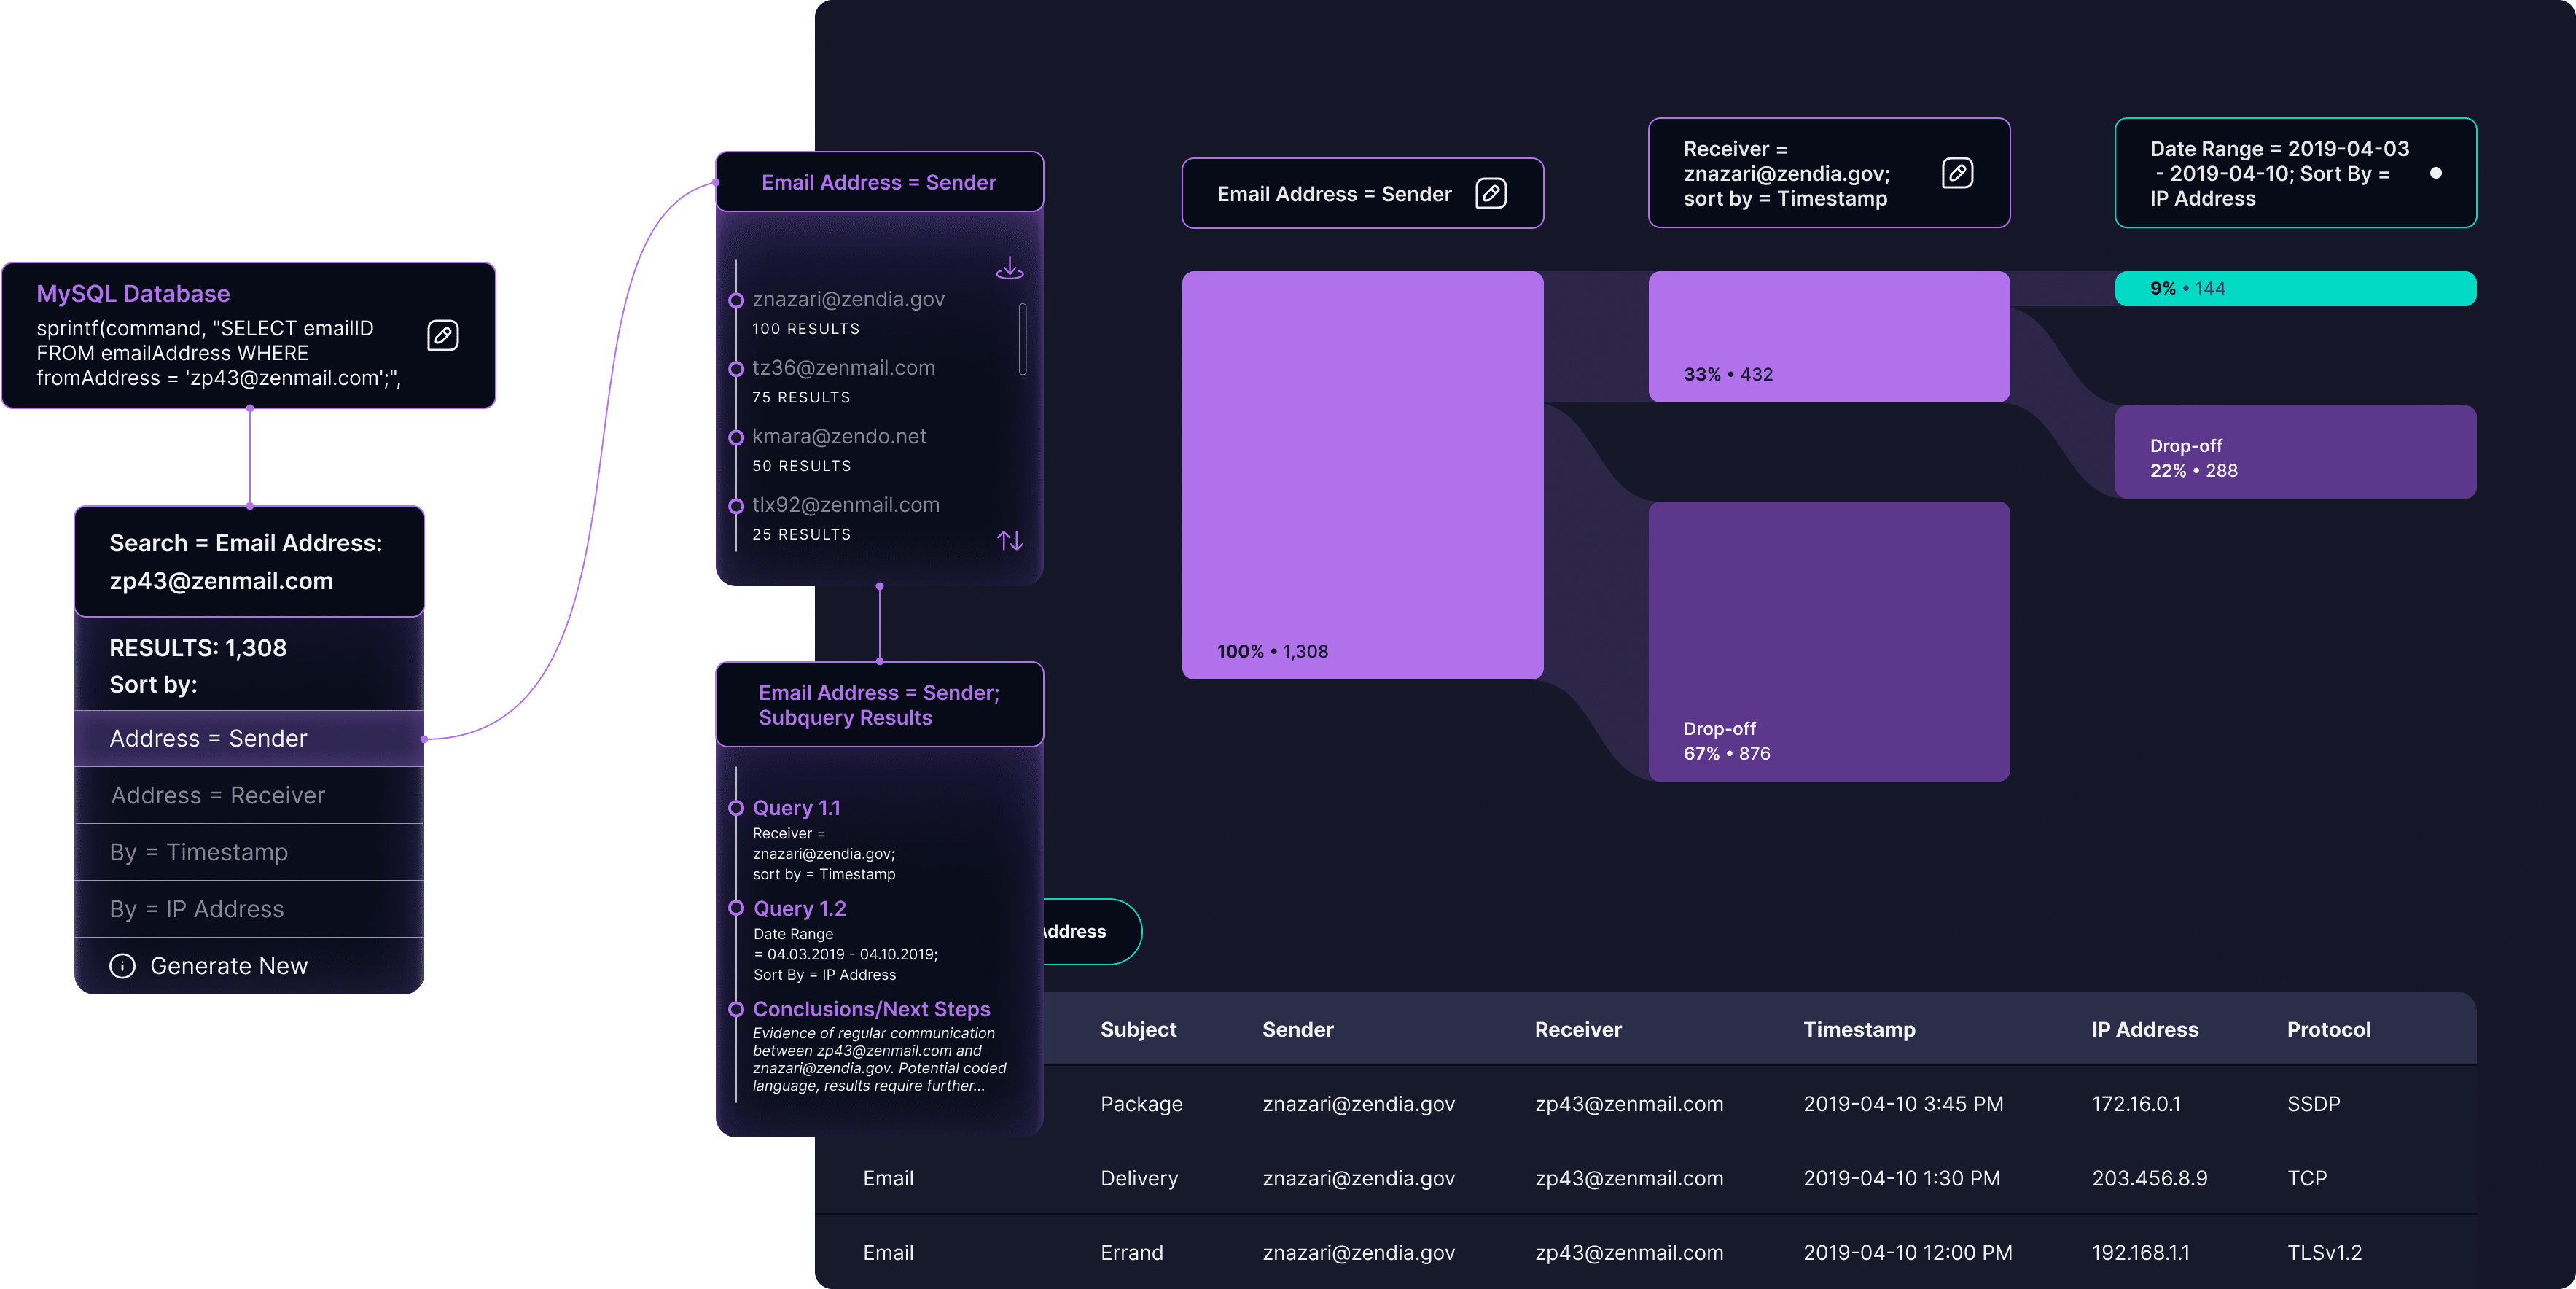
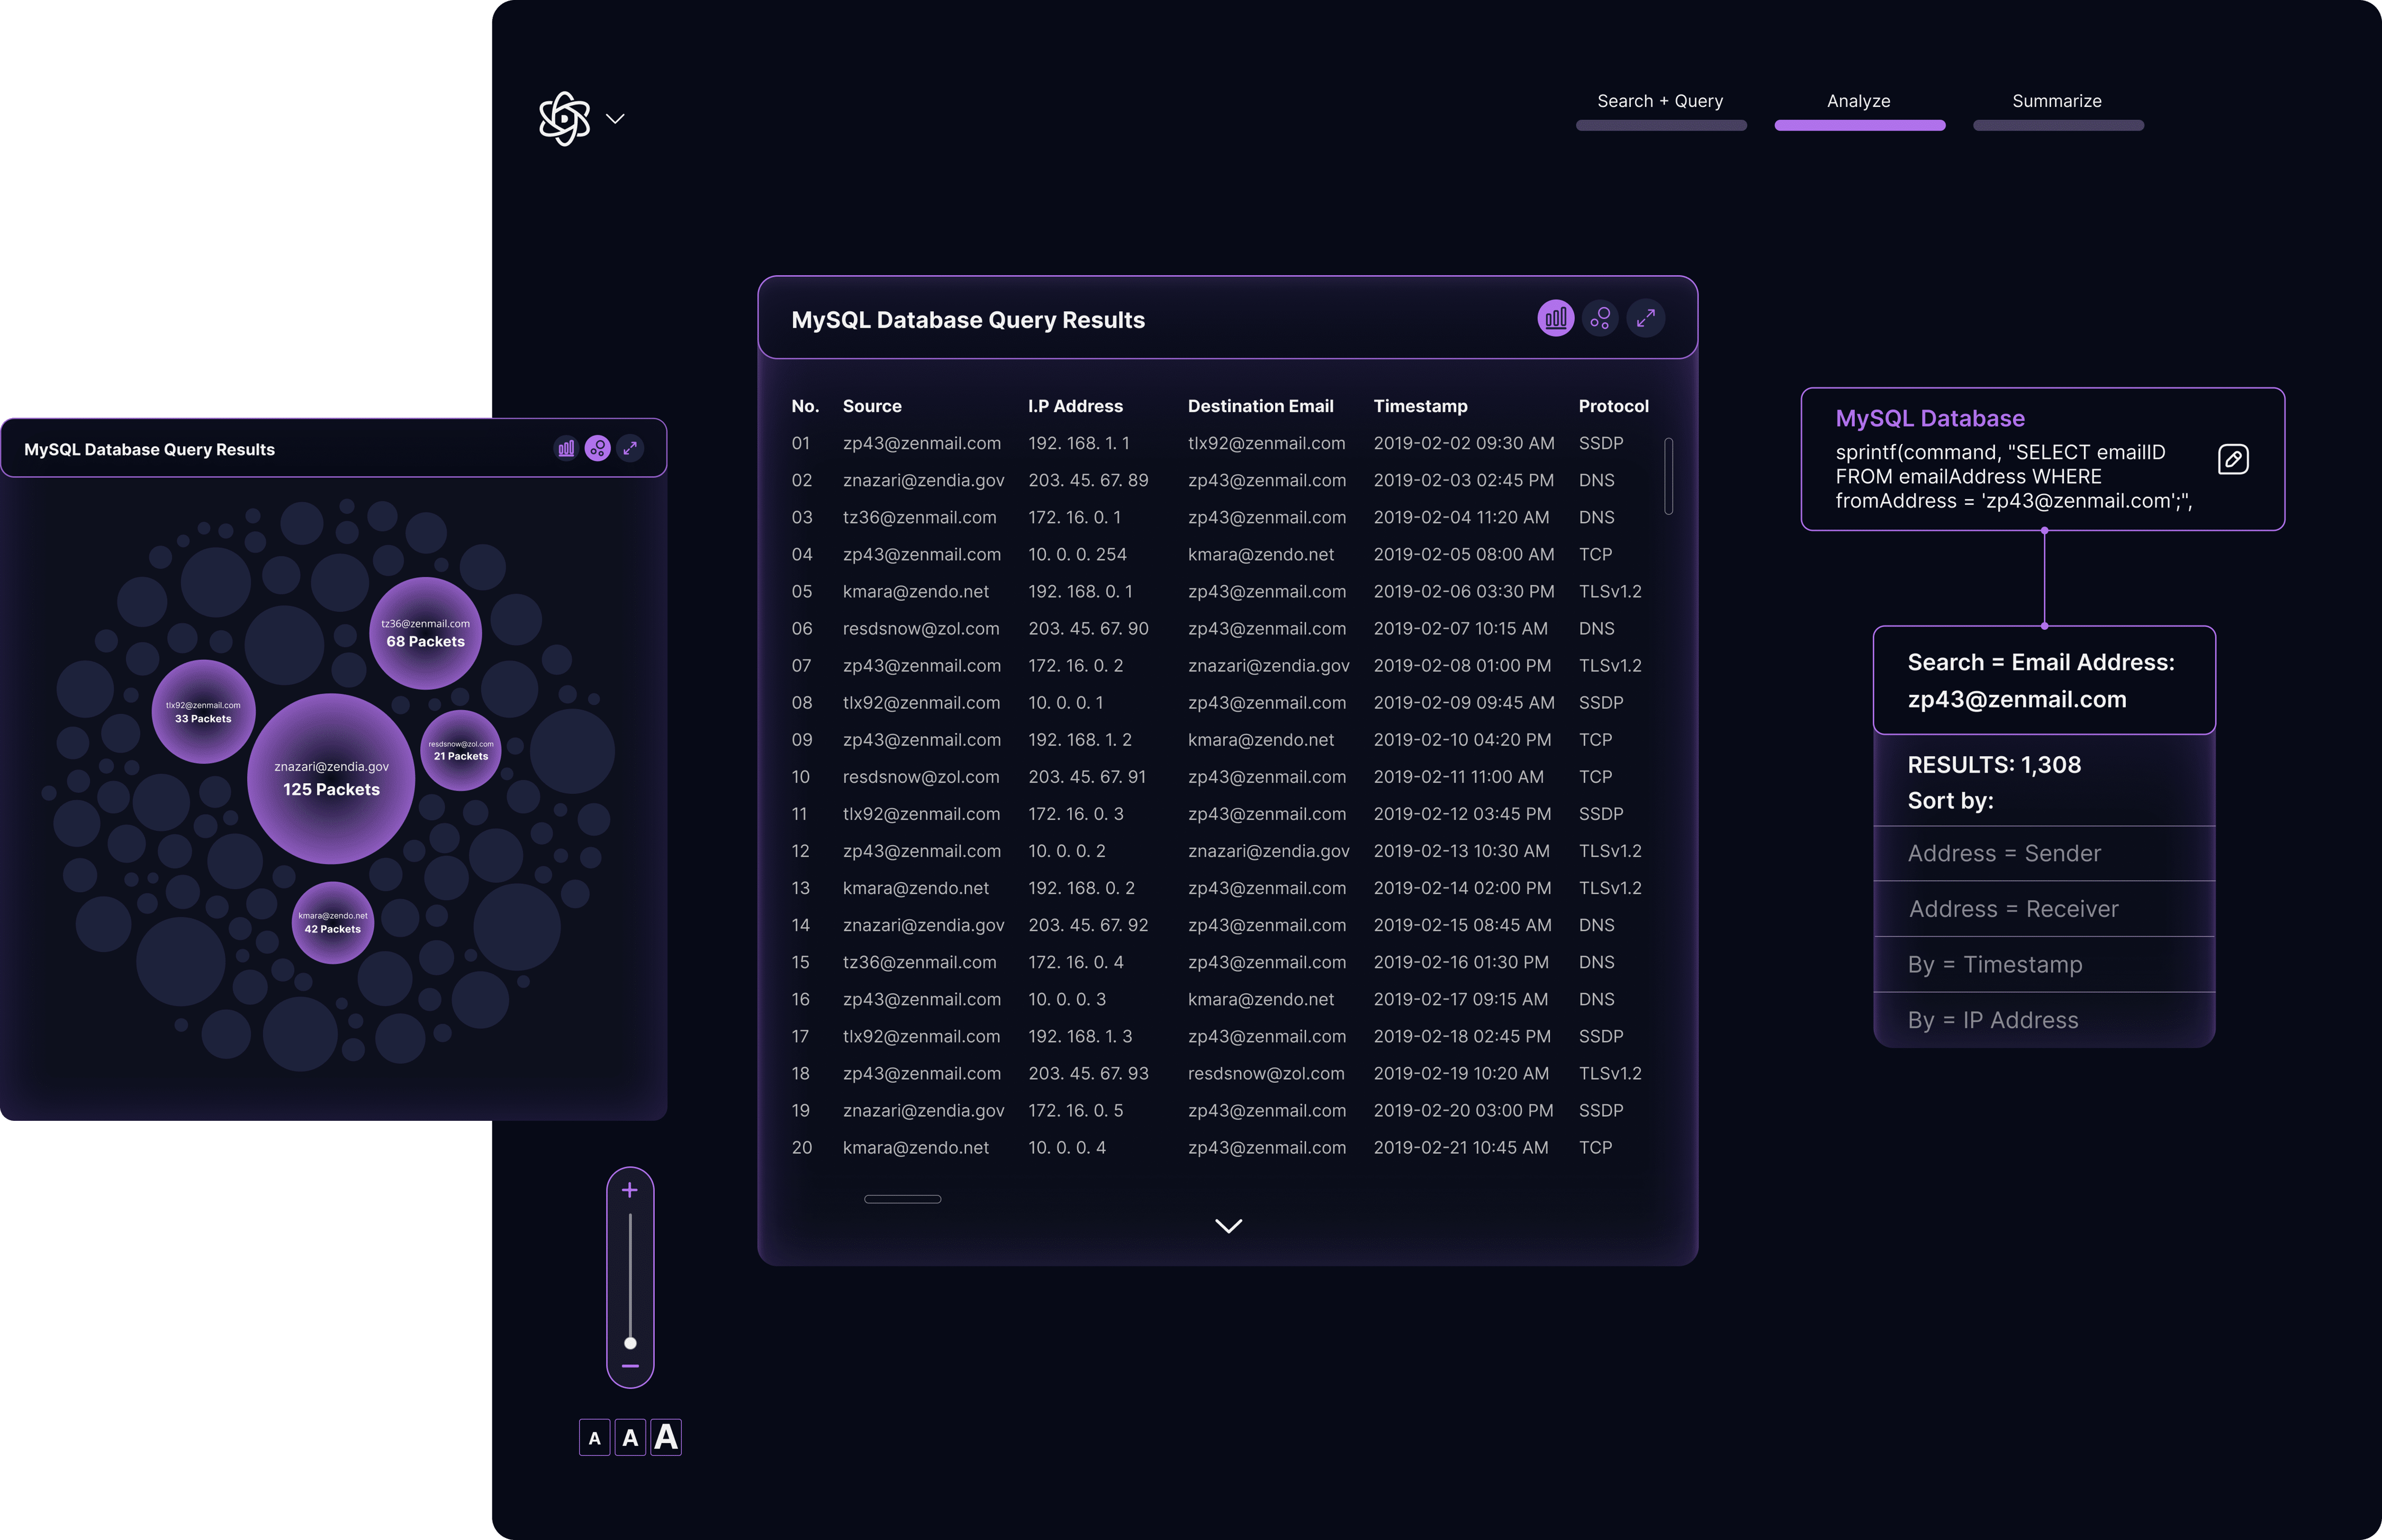
In addition to the tree node system, we incorporated a linked table with the full data set, which could be visualized in multiple formats and updated dynamically based on queries and subqueries. Editable query fields within each node allowed analysts to modify their queries directly and see changes to the output in real time.
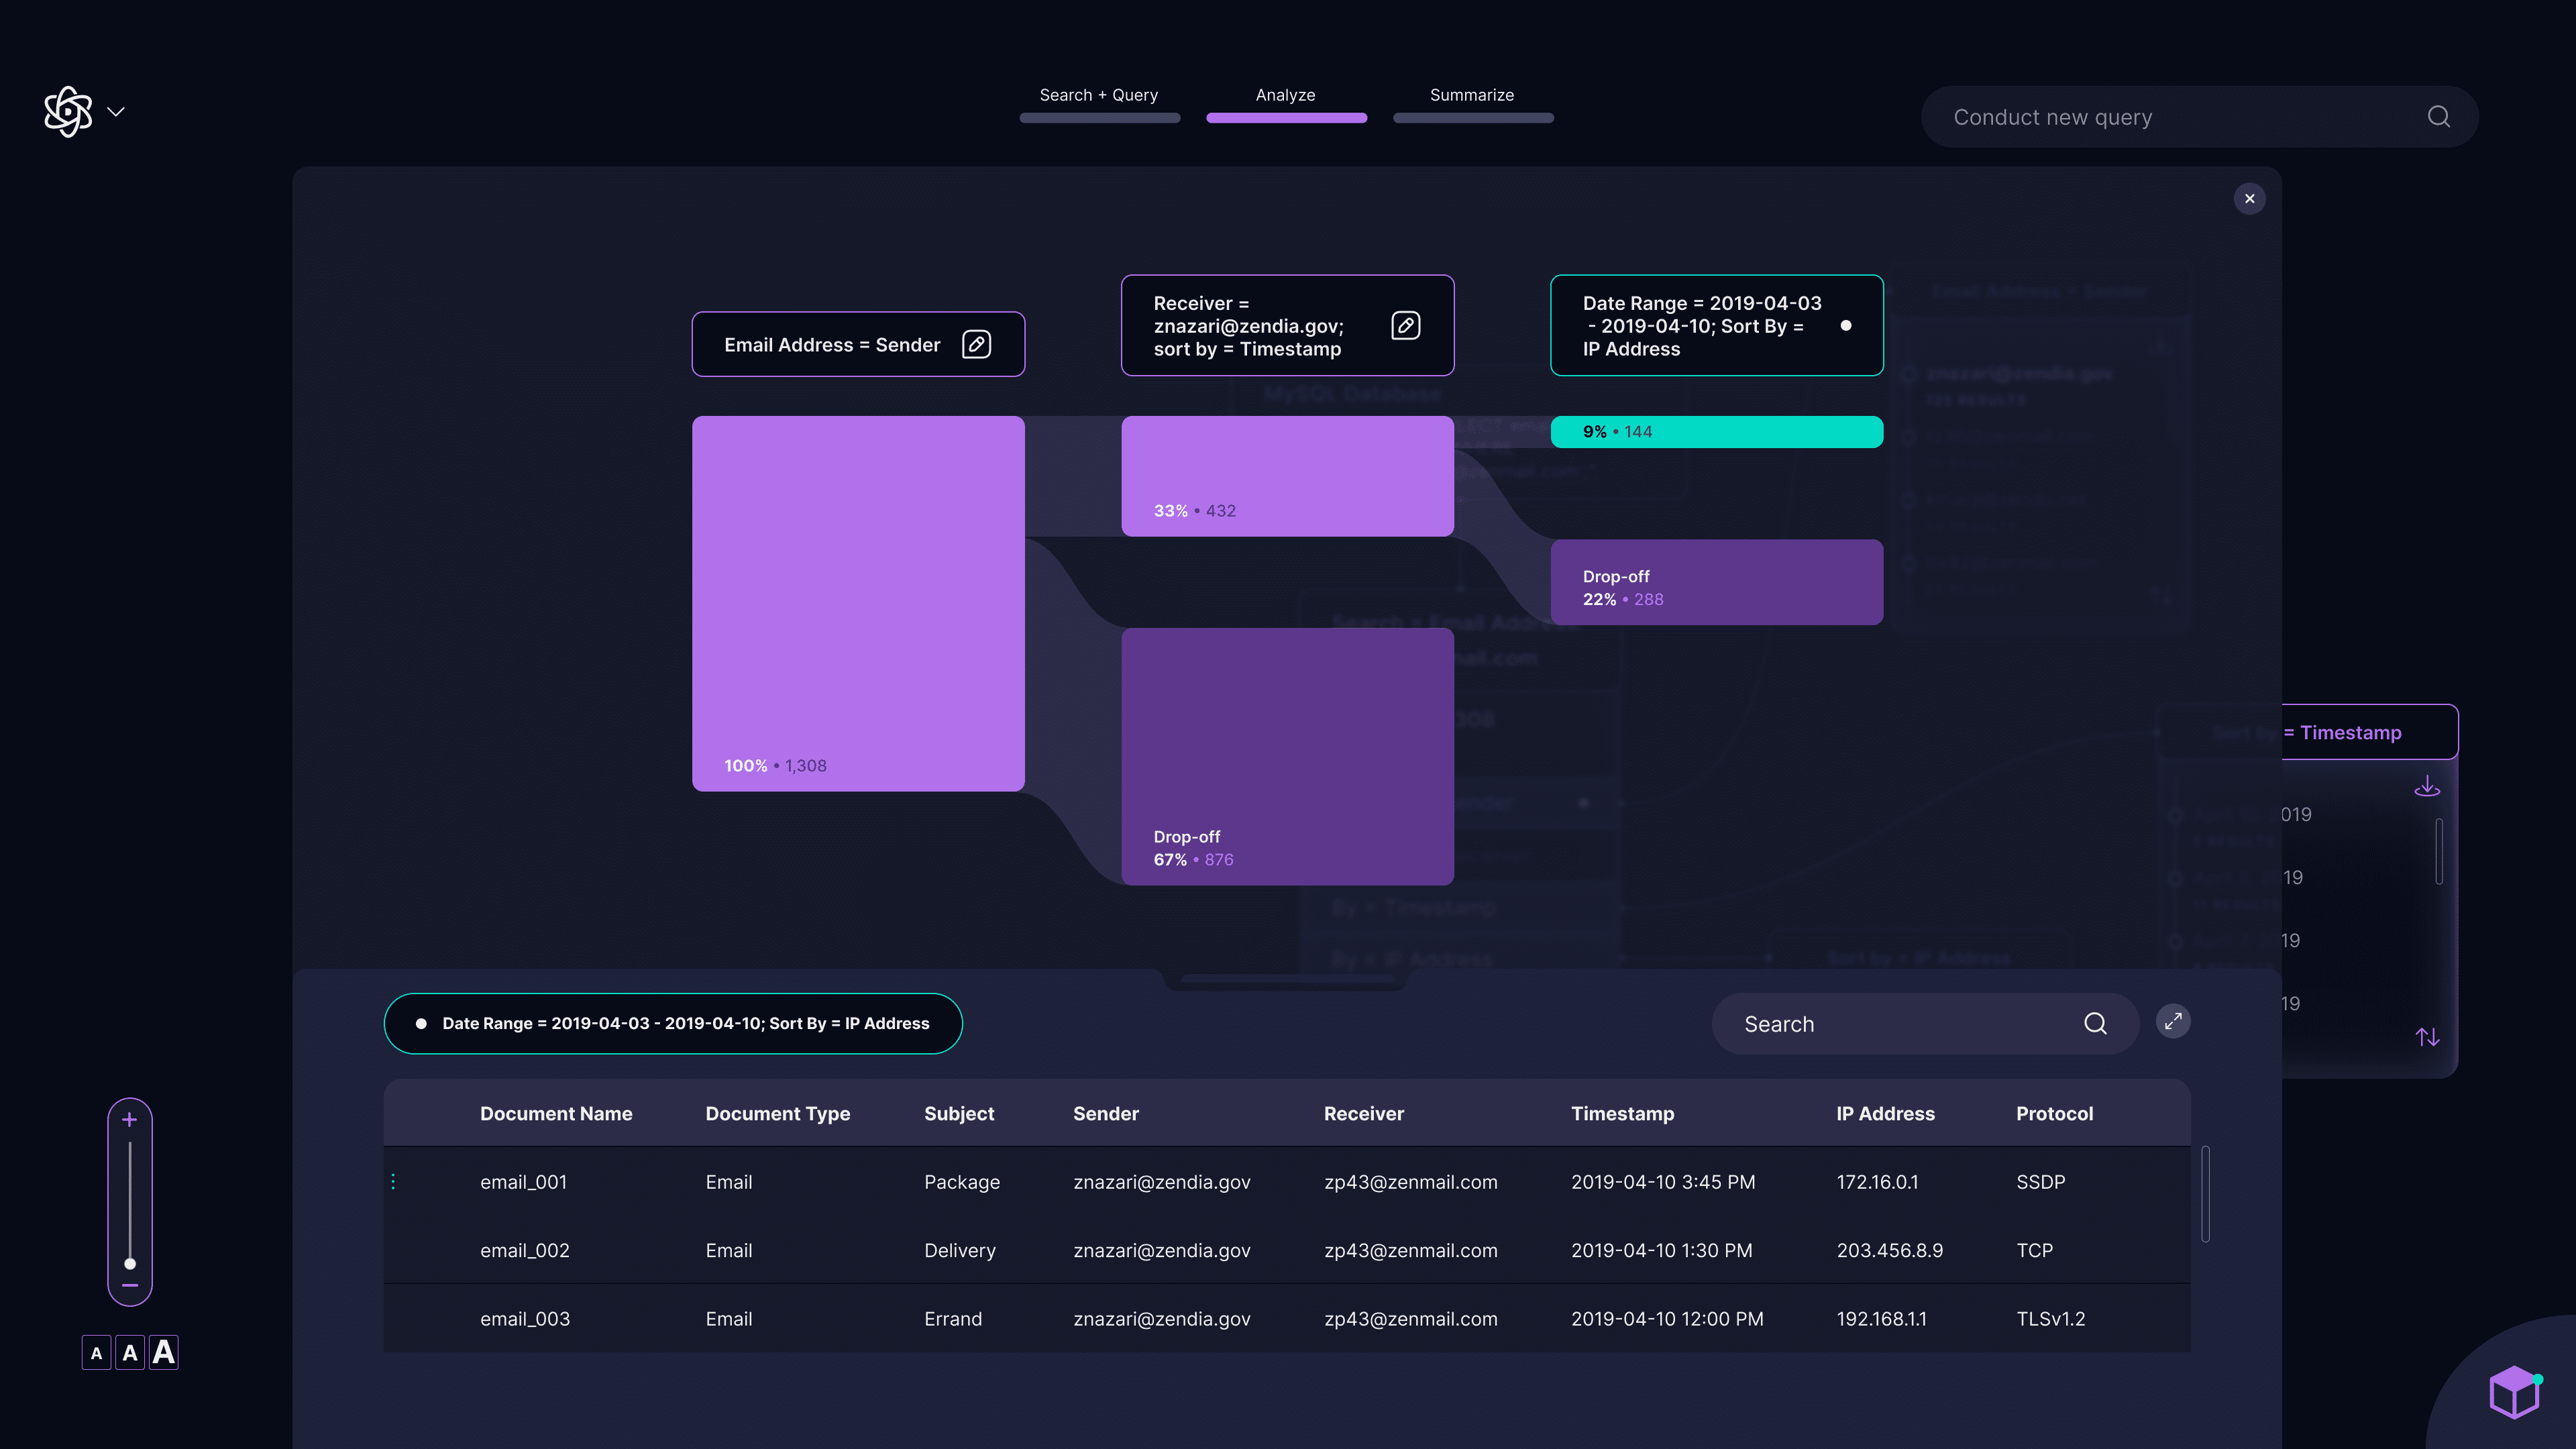
For isolation mode, I designed a Sankey diagram to visually differentiate it from the default analysis screen. To address analysts’ desire to view the full data set, I segmented drop-off points where the system visualizes data outside the new query parameters. The table at the bottom provides access to the full data set and updates dynamically as they fine-tune the output.
AccessibilityThroughout the process, we ensured all essential graphic elements met WCAG contrast requirements and included secondary indicators when color was used as a signifier.
Reflection and Impact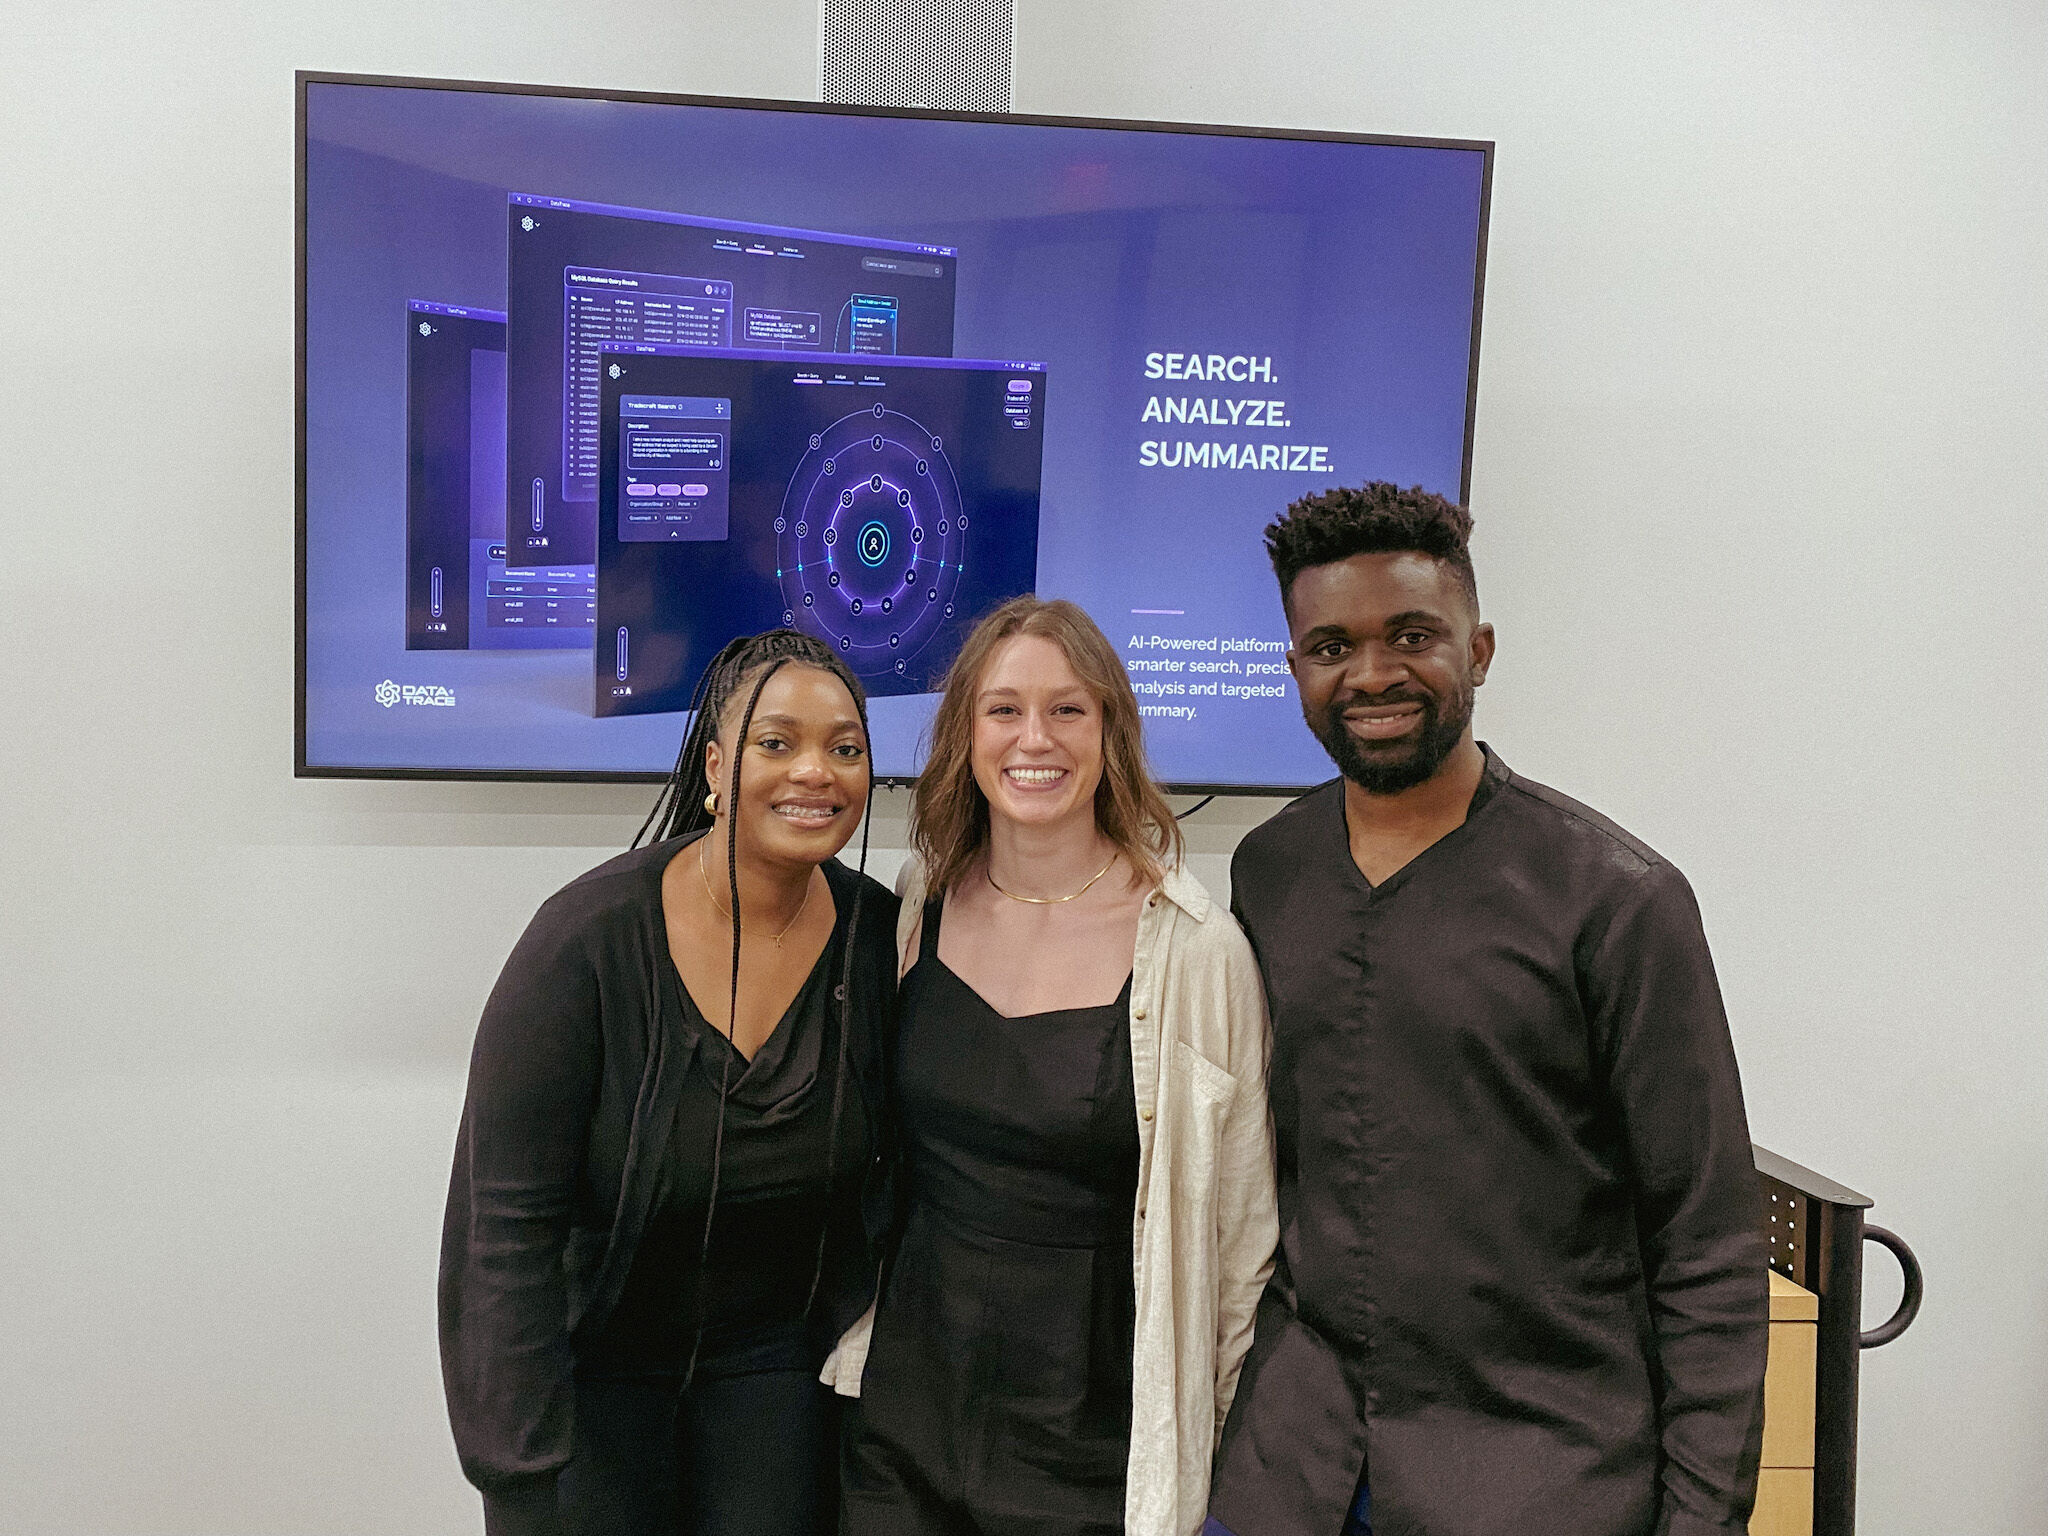 Spring studio presentation with DataTrace team
My contributions were one part of a system and I'm grateful for the dedication, skill, and passion of my teammates.I'm proud of how we leveraged our research to move from an abstract problem space to determining emergent AI capabilites that complement and augment a junior analyst's workflow. I particularly enjoyed working on the querying sandbox because it helped address such a core pain point in the analysts' current experience.Moving forward, I would like to address technology constraints and gather user feedback in order to maximize both value and feasability.
Spring studio presentation with DataTrace team